What Is Yield Curve Inversion?
Key Points – What Is Yield Curve Inversion?
- What Yield Curve Inversion Says About the Direction of the Economy
- Understanding the Basics of Bonds
- The “Flight to Safety” to Hedge Against Market Volatility
- Comparing Today’s Yield Curve Inversion to Previous Yield Curves
- 8 Minutes to Read
Why Does Yield Curve Inversion Serve as an Indicator of a Recession?
Over the last 12 months, you’ve no doubt heard us talk about yield curve inversion and its historically predictive nature with the direction of the economy. I’ve covered it in several articles. Dean Barber has addressed it in his Monthly Economic Updates, on The Guided Retirement Show, and on America’s Wealth Management Show with Bud Kasper.
As you’ve no doubt gathered by now, yield curve inversion tends to indicate that the economy is weakening and likely headed for a recession. But why? What does yield curve inversion mean, and why does it precede recessions? That is the question we’re going to attempt to answer today.
The Yield Curve Pertains Solely to U.S. Treasury Bonds
As we begin this discussion, it’s important to remember that the yield curve we are talking about deals solely with U.S. treasury bonds rather than the broader bond market as a whole. To be sure, yields on treasury bonds affect the broader bond market because they represent the “risk free” rate of return. But that’s a whole other discussion.
Understanding the Basics of Bonds
I want to review some bond basics before we dig deep into understanding yield curve inversion. A bond is nothing more than a loan to a government, a corporation, or a municipality. When you buy a bond, you are effectively the lender. Bonds are issued at what is known as “par value,” which is typically 100. The bond issuer agrees to pay the bond holder a certain percentage (this is known as the coupon) annually on the amount they put into the bond for a certain period.
The bond has a known end date, which is its “maturity” date. The maturity date can be anywhere from a few months to 30 or more years in the future. At maturity, the bond holder will receive back the money that they put into the bond since bonds mature at par value, along with the income they received over the life of the bond. The total of those two amounts of money represents the yield from the bond.
As a general rule, the longer the bond must be held to maturity, the higher the reward should be. And in a normal yield curve environment that is what we see. But when there’s an inverted yield curve, the opposite becomes true as people are willing to pay a premium for long-term protection.
Reviewing the Teeter Totter Example with Bond Prices and Yields
A key thing to keep in mind is the inverse relationship that bond yields have with bond prices. It’s like a teeter totter. When one end of the teeter totter is high, the other is low. So, if prices are up, yields are down. And if yields are up, prices are down. It never ceases to amaze me the number of people who aren’t aware that bond prices fluctuate, but they do.
Bonds are priced daily, and their values can either be higher than (at a premium to) or lower than (at a discount to) their par value. If you buy your bond at a premium, your yield to maturity (YTM) will be lower than if you had bought the bond at par. If you buy at a discount, your YTM will be higher than if you had bought the bond at par.
The bond market is massive! In the U.S. alone, the bond market has about a $40 trillion value. The U.S. stock market is valued at about half that amount.
The “Flight to Safety” to the Bond Market
The people that live in the bond market are a different breed and do things completely different from those that live in the stock market. I call them the adults in the investing world (most of the time) because they are more thoughtful, methodical (again, most of the time), and much less impulsive than their stock market counterparts. Their sense of the economy is more closely related to reality because they are on the side of the market that funds the growth that we all love (the debt side) and can see when things start getting shaky well before the stock market guys know anything is wrong.
Eventually, though, the stock market guys catch on, too, and begin what we call the “flight to safety” to hedge against market volatility. Look at Figure 1 below from the Investment Company Institute to see what I mean. It shows equity mutual fund outflows from 2020 to today.
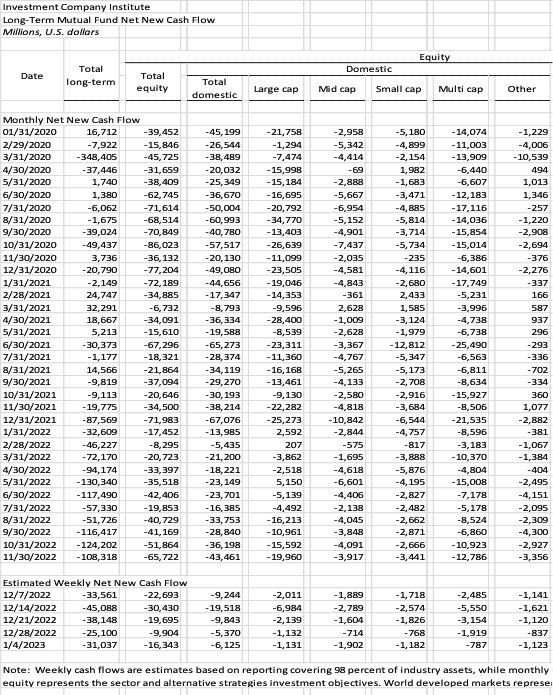
FIGURE 1 – Long-Term Mutual Fund Net New Cash Flow – Investment Company Institute
The Recipe for Yield Curve Inversion
In 2022, long-term mutual funds suffered net cash outflows of $1.092 trillion. That is 2.25 times the amount they suffered during the pandemic of 2020. The flight to safety in 2022 was real indeed! Where’d they all go?
They went here. Look at the flows into long-term bonds last year in Figure 2. Fifty billion dollars went into long-term and intermediate bonds, and short-term bonds saw outflows of almost $50 billion. That, my friends, is a recipe for yield curve inversion.
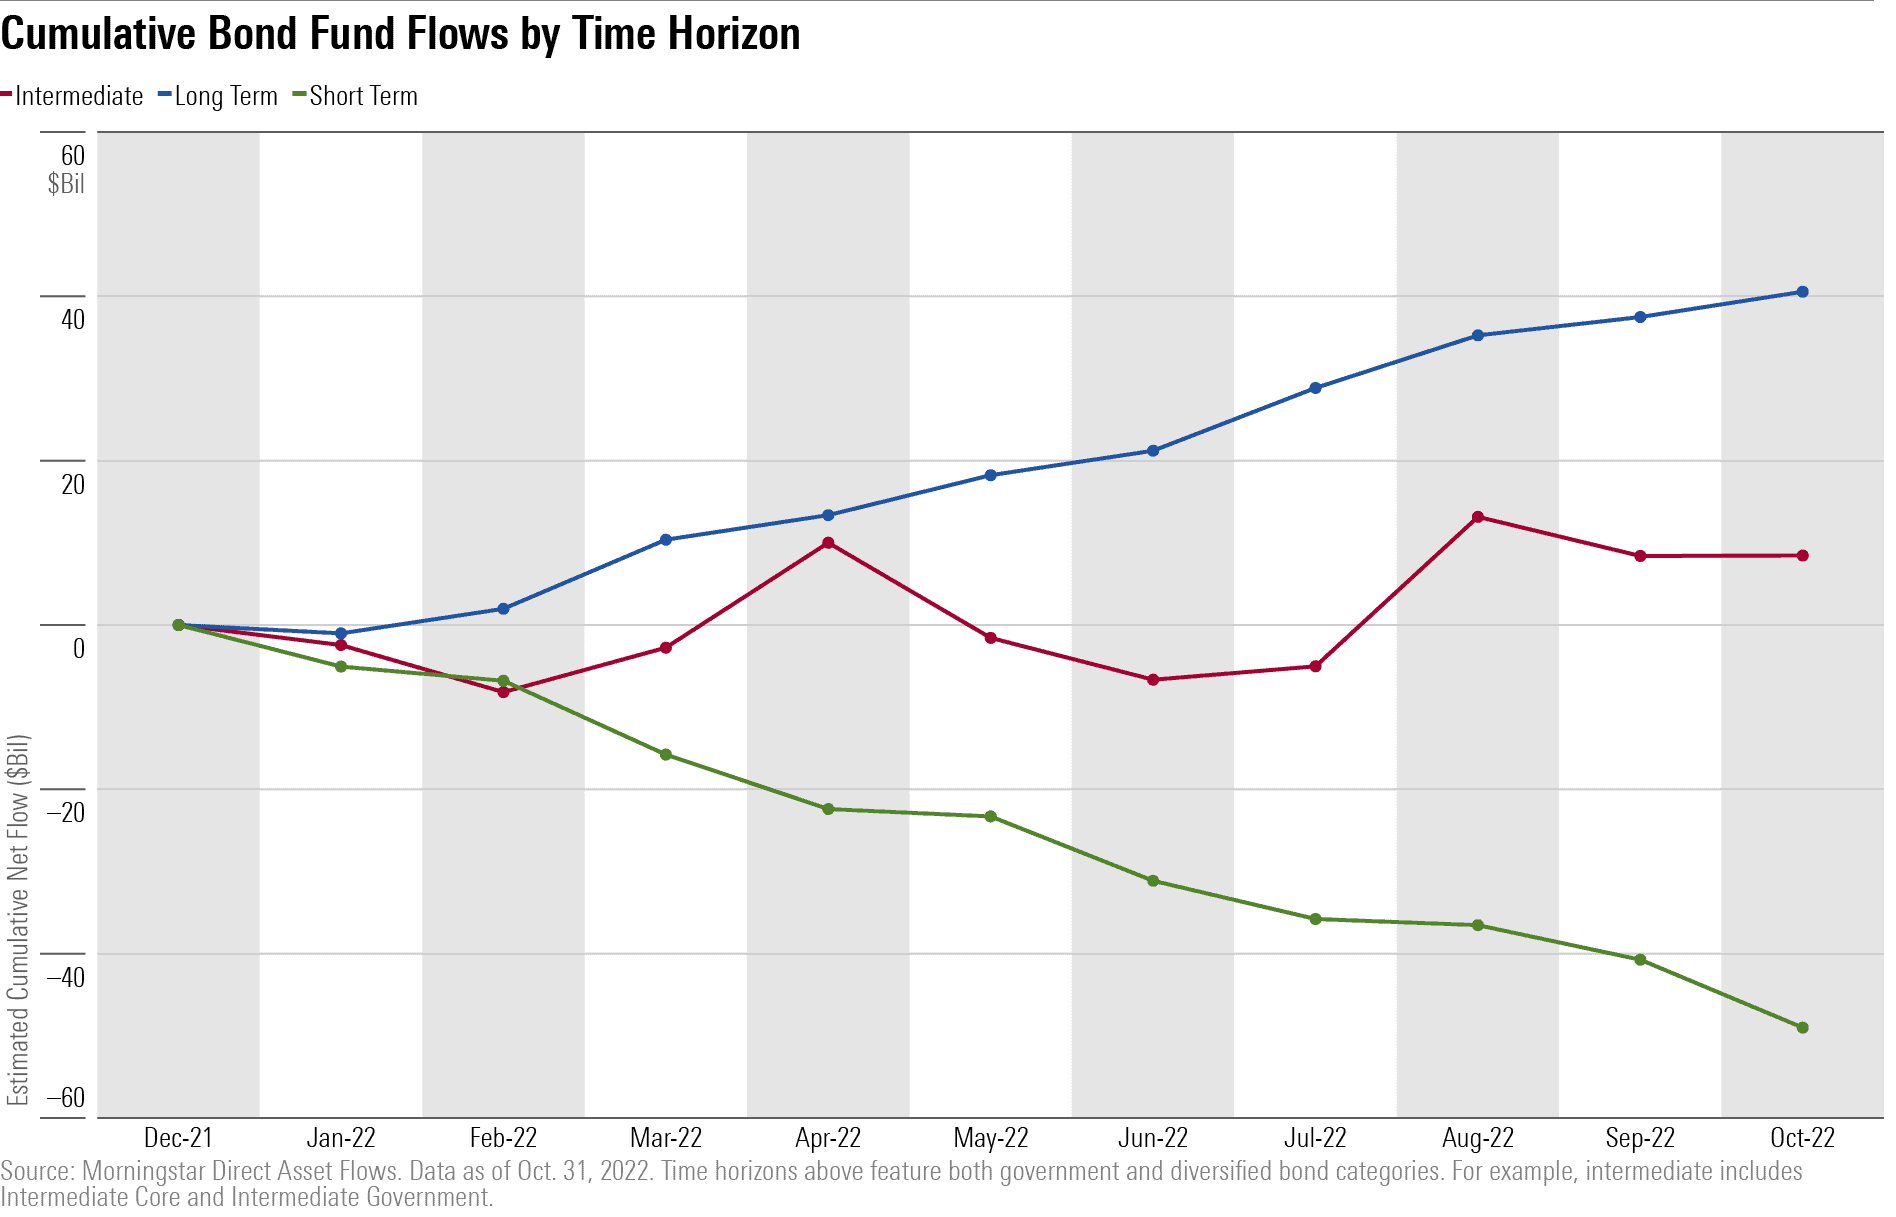
FIGURE 2 – Cumulative Bond Fund Flows by Time Horizon – Morningstar Direct Asset Flows
The flow into long-term bonds has driven the prices of long-dated treasury bonds through the roof. Figure 3 is an example that I pulled off the TD Ameritrade fixed income portal. This 30-year treasury was issued in 1999, matures in 2030, and has a 6.25% coupon. Notice that the price is nowhere near the par value of 100. These bonds will cost you over $116 today and will only be worth $100 at maturity. So, despite paying 6.25% annually, the premium price reduces the yield of the bond to just 3.6%.
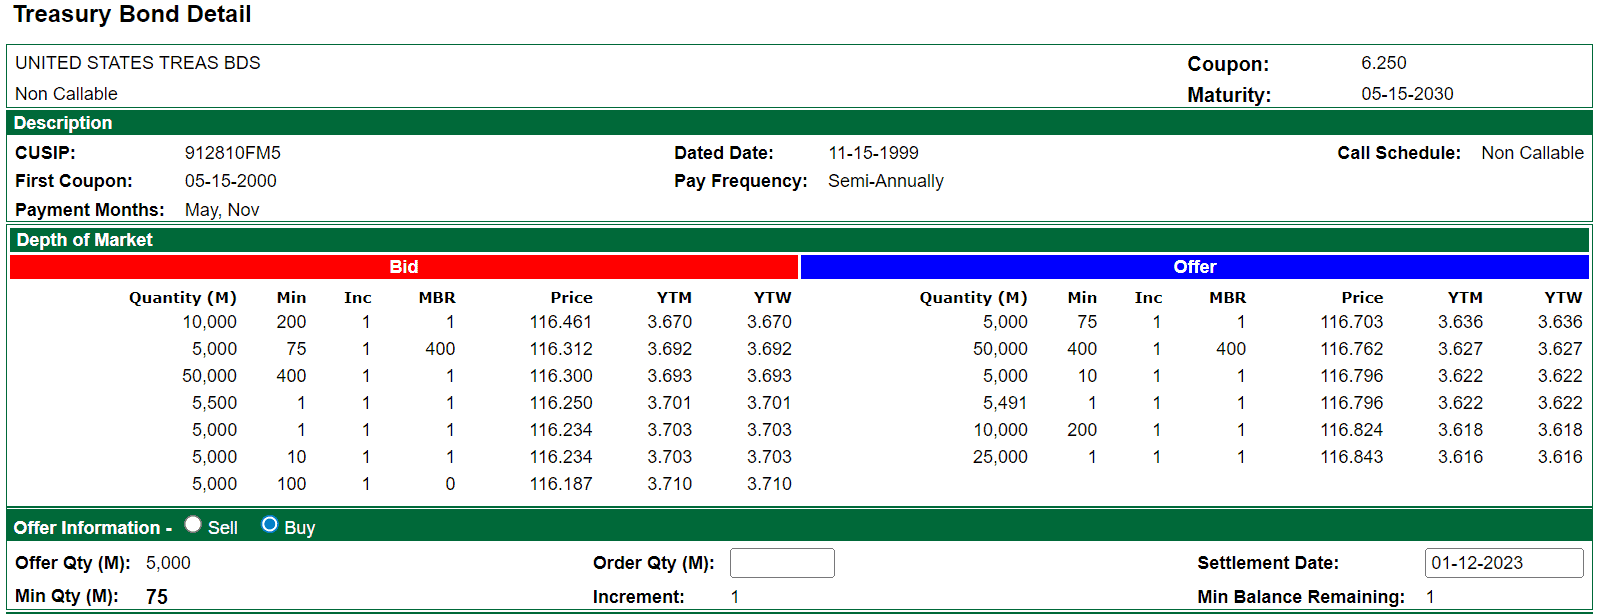
FIGURE 3 – 30-Year Treasury Example – TD Ameritrade
The opposite is happening to short-term treasuries. They are trading at discounts to their par value today. The bond below was issued last January and matures in January 2024. It has a coupon of a mere 0.875%, yet due to its low price of only $96 its YTM is 4.629%.
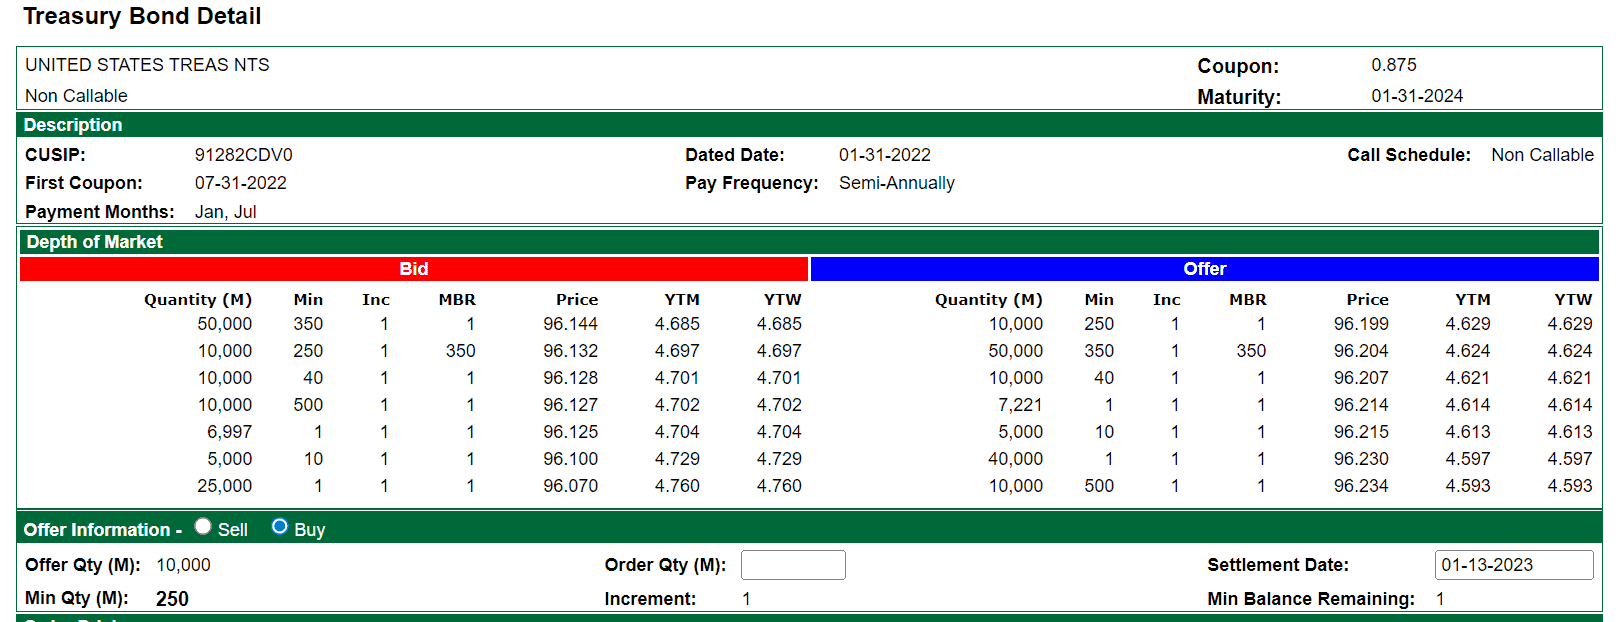
FIGURE 4 – Short-Term Treasury Example – TD Ameritrade
Looking at Today’s Yield Curve
Based on these money flows, someone, rather a large group of someones, is overreacting in my opinion. But that’s nothing new. Figure 5 shows what the yield curve looked like on January 11.
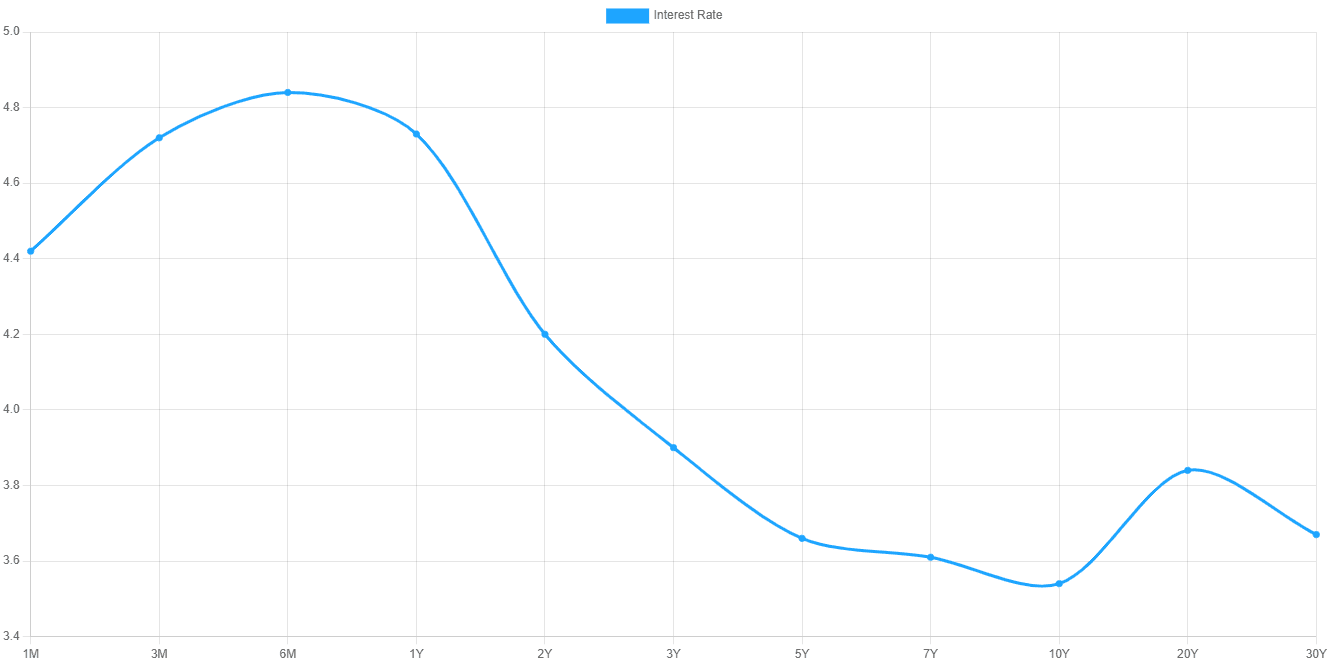
FIGURE 5 – U.S. Treasury Yield Curve on January 11, 2023 – U.S. Treasuries Yield Curve
You can see that the highest yield available on that day was in the six-month treasuries, and the lowest yield was in the 10-year treasuries. That is the result of the flight to safety money going into longer-dated treasuries, driving up their prices.
In Figure 6, you will see a snapshot of the other segments of the bond market that I pulled from the TD Ameritrade fixed income portal. You will notice that the only segment of the bond market that has inverted yields is the U.S. treasury market. Other bonds still offer a higher yield for longer maturities with very limited exceptions.
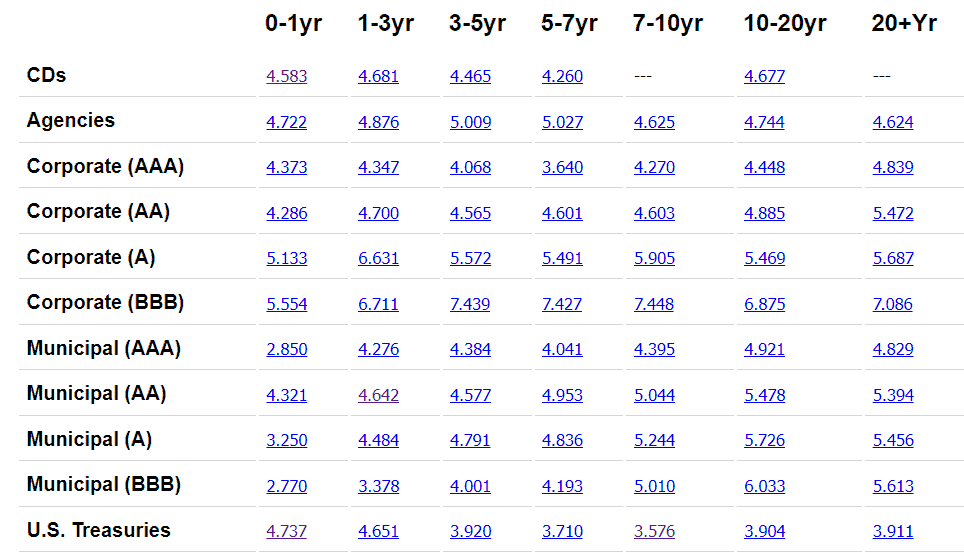
FIGURE 6 – Bond Market Yields and Maturities – TD Ameritrade
Comparing Today’s Yield Curve to Other Yield Curves
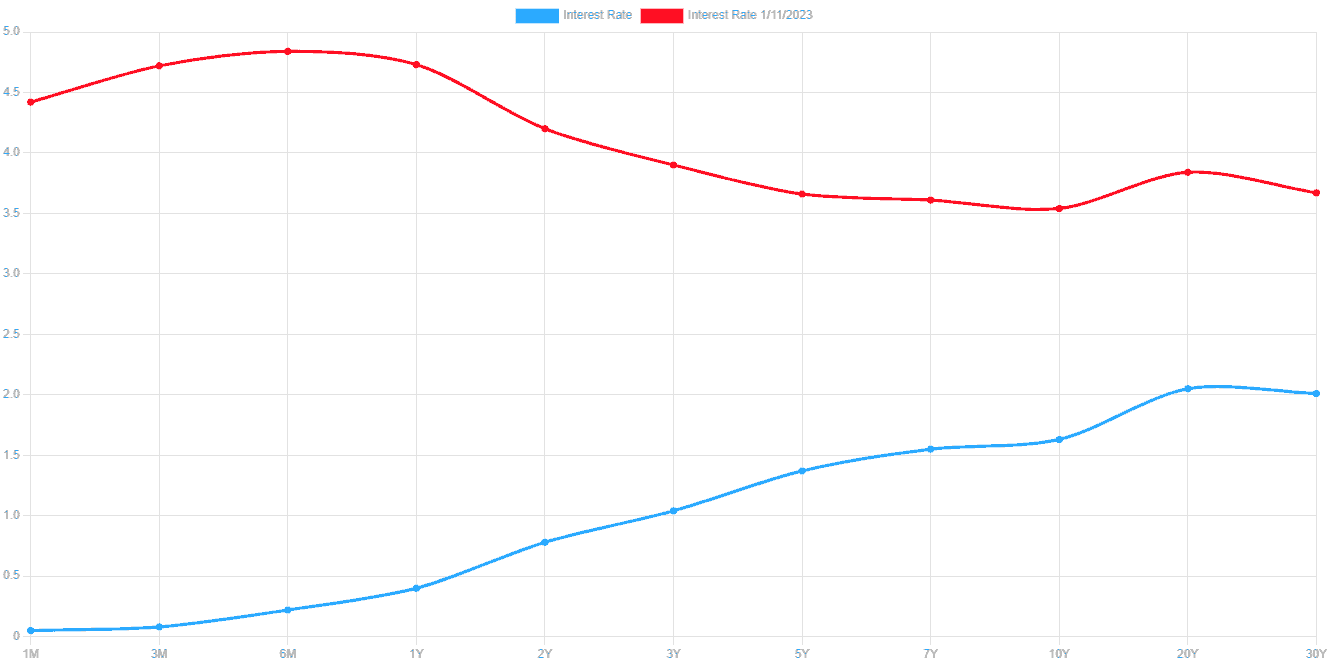
Now, in Figure 7, let’s look back to January 3, 2022 (blue line). You can see that the yield curve was basically normal compared to where it was on January 11, 2023 (red line).
We would also be remiss if we didn’t look back in history to the last time we were dealing with high inflation and an impending recession, which was in 1981. Figure 8 shows that the yield curve on June 16, 1981, and the one from January 11, 2023, are similar in shape, just with different numbers. They are two of the starkest examples yield curve inversion in modern history.
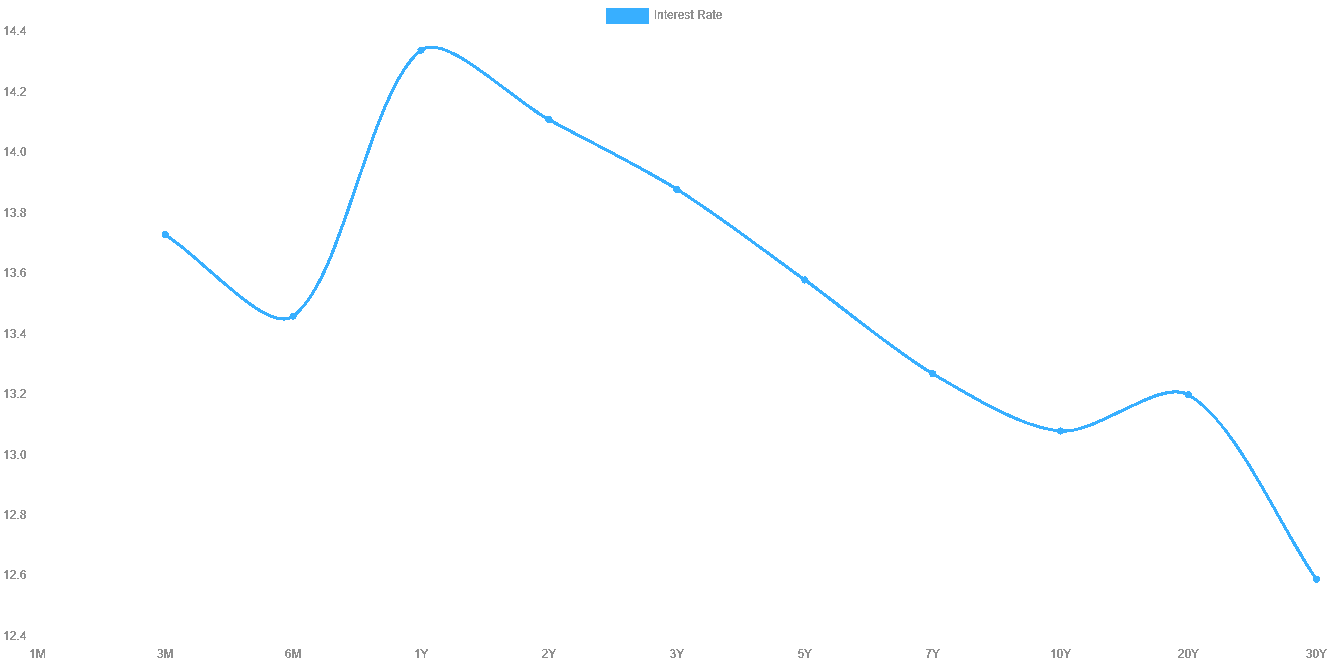
The good news for us today, looking back, is that it took less than 13 months for the yield curve to return to “normal” and 24 months later it looked like this in Figure 9.
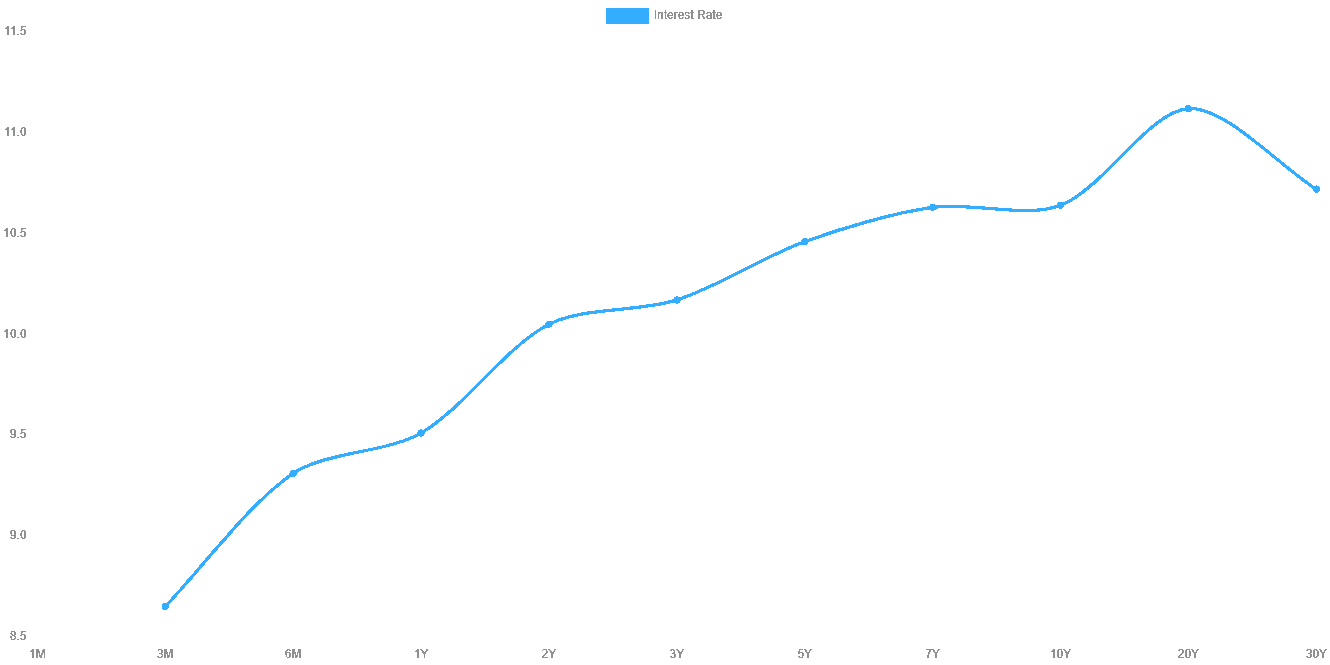
FIGURE 9 – U.S. Treasury Yield Curve on June 16, 1983 – U.S. Treasuries Yield Curve
Back to Our Original Question: What Does Yield Curve Inversion Mean?
Now that that’s all that out of the way, it’s time to answer the question from the beginning of this article. What does yield curve inversion mean and why does it precede a recession?
Yield curve inversion simply means that people (investors) are not confident in the direction of the economy, for whatever reason they may have at the time, and are unwilling to continue to expose their capital to losses. Remember that U.S. treasuries are considered the “risk-free” investment, and that’s where the scared money goes. Every time.
Those people don’t know how long the economic turmoil they are sensing will last, and tend to err on the side of buying longer-term bonds than they probably should. On one hand it makes sense, since you can set it and forget it, and focus on other things without the worry of losing money. However, that becomes a problem for the broader economy.
The Repercussions of the Flight to Safety
The flight to the safety of U.S. treasury bonds removes productive capital from the economy, and parks it in the relatively unproductive coffers of the government. This movement of capital from productive to unproductive use, when conducted on a mass scale like we saw last year, has real world consequences. Money invested in stocks and bonds helps fund business and economic growth. Money invested in municipal bonds helps fund schools, airports, water treatment plants, and tons of other critical infrastructure projects which help support and promote economic growth.
But money invested in treasuries…not so much. Not that it is completely unproductive, but that it is much less productive than it would otherwise be. It’s not a secret that our federal government isn’t very efficient at getting money into the places where it’s needed and when it’s needed. That’s not intended as a slight, just a statement of fact.
How Yield Curve Inversion Can Lead to a Recession
So, when all that money is no longer being used productively, the economy eventually begins to suffer. Business slows as people become more cautious and pull back on their spending. Projects that were waiting on funding get delayed until money becomes more readily available. Business expansion plans get put on hold. People begin to experience layoffs, or reduced hours. And it just becomes this giant snowball rolling down hill, picking up speed and size with every foot it travels. And, next thing you know, recession.
It all takes time to develop. It’s not like it happens overnight. But happen it does. As I’ve written in previous articles, the lag time between a yield inversion and the onset of a recession is pretty wide, ranging anywhere from eight to 24 months. We’re seven months into this yield curve inversion.
We’re in an Atmosphere of Fear
You could almost make the argument that a recession is the self-fulfilling prophecy of the yield curve inversion because of the factors that cause the yield curve to invert in the first place. Namely, fear. This year, we’re getting some help in making the recession more likely to materialize from the Federal Reserve and their rising interest rate policies which are intended to get inflation under control. Those policies, as we’ve discussed in other articles this year, slow economic activity by design. They also cause fear.
Fear is the enemy of action and productivity. When people are scared, they hunker down and wait for whatever is causing the fear to pass. Whether it’s high interest rates, runaway inflation, or a pandemic that causes the fear, the reaction is the same.
People that were going to buy a new home are now waiting for interest rates to come back down. People that were going to buy a new vehicle are doing the same. And people that were going to buy a used vehicle are waiting for the overinflated prices to come back down. The fact that people are waiting and willing to wait for an extended period will make the high-wire walk the Federal Reserve is attempting something Karl Wallenda would think twice about.
Planning for Retirement During a Recession
In closing, let me remind you that recessions don’t kill retirements. Not having a plan does. It’s the not knowing that creates the fear. Fear that creates the inaction. And the inaction that leads to failure.
Modern Wealth Management clients have a plan that we’ve built specifically for their unique situation. Sleep well knowing that you’re going to be OK. If you do have questions about this yield curve inversion, please reach out to your advisor. We’re here to help you.
If you’re not a Modern Wealth Management client and/or don’t have a plan, we’d love to help you too. There is so much more to a financial plan than your investments, and our financial planning tool can help to show you that. We’re giving you the opportunity to use the same tool that our CFP® Professionals use with our clients at no cost or obligation. Just click the “Start Planning” button below to begin building your plan from the comfort of your own home.
We can also answer your questions about this yield curve inversion as well. You can schedule a 20-minute “ask anything” session or an hour-long complimentary consultation with one of our CFP® Professionals by clicking here. You can meet with us in person, virtually, or by phone.
Schedule a Complimentary Consultation
Click below to get started. We can meet in-person, by virtual meeting, or by phone. Then it’s just two simple steps to schedule a time for your Complimentary Consultation.
Investment advisory services offered through Modern Wealth Management, LLC, an SEC Registered Investment Adviser.
The views expressed represent the opinion of Modern Wealth Management an SEC Registered Investment Adviser. Information provided is for illustrative purposes only and does not constitute investment, tax, or legal advice. Modern Wealth Management does not accept any liability for the use of the information discussed. Consult with a qualified financial, legal, or tax professional prior to taking any action.