Lost Decade of the 1970s and Why It Still Matters
Key Points – Lost Decade of the 1970s and Why It Still Matters
- The 1970s Brought Significant Technological Innovations
- Similarities Between the 1970s and 2020s
- Then and Now: The Federal Reserve’s Fight with Inflation
- The Cost and Availability of Energy Affects Everything
- What Can We Learn from the Lost Decade of the 1970s?
- 13 Minutes to Read
Why Is the Lost Decade of the 1970s Still Important?
The 1970s was a decade of technological advancements, inflation, stagnant wages, energy crises, geopolitical uncertainty, war, rebellious youth, and political scandal. Sounds eerily like what’s happening in our world today, doesn’t it? That’s because it is, which is why the lost decade of the 1970s still matters some 50 years later. Remember, those who don’t know their history are doomed to repeat it. I, for one, would rather not.
So, let’s look back at some history and see if we can glean some clues for what the rest of the 2020s could have in store for us, and how we can navigate through what may indeed be difficult years ahead. First, let’s go on a little trip down memory lane.
Technological Advancements of the 1970s
You may remember some of these technological advancements that came in the 1970s. In 1970, the Canon Pocketronic calculator hit the market, bringing pocket calculators into common use among students and professionals alike. The following year, Ray Tomlinson brought us the first version of email. It ran on the ARPANET system. In 1972, Atari brought us Pong, an electronic version of ping pong you could play at home. Also in 1972, the floppy disk became the data storage device of choice and would remain so for the next 20 years.
These Technological Advancements Were Life-Changing
Speaking of data storage, Philips introduced us to the VCR in 1972. Never again would we have to miss another episode of our favorite TV show. We could record it and watch it later. Revolutionary. In 1973, Motorola introduced the cell phone prototype. Though they wouldn’t be commercially available for another 10 years, they certainly changed the world. We all have one in our pocket today.
The first commercial barcode scan occurred in 1974. We couldn’t use self-checkout today without that technology. 1974 also brought us the ubiquitous Post-It note. My wife would not be able to function without these things. They’re all over my house with lists, bible verses, reminders, and other communications on them. At least they’re colorful. That same year the Rubik’s Cube was invented and became one of the most popular toys ever. More than 350 million of them have been sold. My teenage grandson has dozens of them, in all kinds of sizes, and he is unbelievably good at solving them.
1975 saw the advent of the first Microcomputer, the Altair 8800, and the first commercially available digital camera that could capture an image at a maximum of 32 pixels by 32 pixels. One year later, the Apple computer came out. Near the end of the decade, in 1978, GPS became a real thing thanks to the efforts of the U.S. Department of Defense. And, finally, 1979 brought us the Sony Walkman, changing the lives of teenagers everywhere and saving parents from having to listen to their kids’ music blaring in the background.
Lost Decades in the Stock Market
on America’s Wealth Management Show
We talk a lot about stress testing for a variety of economic conditions when building a financial plan. It becomes that much more important when a lost decade occurs. That’s when the stock market is flat for 10 years or more. Dean Barber and Logan DeGraeve look at some recent examples of lost decades—such as the 1970s and 2000s—and how to ensure that you can still retire with clarity and confidence on America’s Wealth Management Show.
Monetary Policy of the 1970s
As we entered 1970, the U.S. economy was in recession. Then, President Richard Nixon was looking to be re-elected in the 1972 presidential election. He would’ve likely failed if the economy was still in recession at election time. So, in early 1970, Nixon fired then Fed Chair William McChesney Martin and appointed Arthur Burns as his replacement. Burns was formerly Nixon’s presidential counselor.
Stock Market Soars, Unemployment Declines, GDP Grows, Manageable Inflation – Everything Is Great, Right?
Nixon urged Burns to loosen monetary policy to get the economy booming again in hopes he might win re-election. So, Burns and the Federal Reserve Board took the Fed Funds rate from 9% all the way down to 3.5% by February of 1972. It worked. The economy and stock market took off, and Nixon won handily. From the low in 1970 to the peak in 1972, the stock market had gained 39%. Unemployment was on its way down, GDP grew by 5.2%, and inflation was a very manageable 3%.
Not So Fast
But all was not well. As always, the easy money policy undertaken to spur the economy began to bring inflation into the equation. The M2 money supply jumped by 36% from 1970 to 1972, and the rate of inflation crept higher in 1973 to 3.6%. That gave Burns an uneasy feeling that inflation may get out of control. Which it did the very next year, but not solely due to monetary policy.
The Recipe for High Inflation
There were a series of things happening that, together, would set up the period of high inflation that would soon emerge. The end of the Bretton Woods system that tied the U.S. dollar to gold at the fixed price of $35 per ounce was official in early 1973. The reasoning was that there were too many dollars in circulation globally in relationship to the amount of gold that the U.S. held, making the dollar overvalued in the eyes of our trading partners around the world. There were several runs on the dollar in the three years leading up to this that had the effect of devaluing the dollar, and leaving Bretton Woods made the devaluing permanent.
Geopolitical Conflict
At the same time, in 1973, as we were bringing our troops home from Vietnam, another war was going on between the Arabs and Israel, commonly known as the Arab-Israeli War. Upset with the U.S. decision to resupply the Israeli military during the war, Arab members of OPEC imposed an oil embargo against the U.S., and other countries who supported Israel.
Not only did they ban the sale of oil to the embargoed countries, but they also cut production. Oil jumped from $3.50 per barrel to over $10 per barrel almost overnight. That’s the modern-day equivalent of going from $24 dollars a barrel to $63 a barrel. In terms of impact at the pump, it’s the difference between $1.50 per gallon of gasoline and $3.50 per gallon of gasoline. It’s painful.
The Cost and Availability of Energy Affects Everything
So, we entered 1974 with a demoralized population. We held devalued dollars and faced rising prices on everything because the price of everything is affected by the cost and availability of energy. I repeat, everything is affected by the cost and availability of energy.
Another Recession
The results were nothing short of disastrous. The U.S. entered another recession. Inflation shot up to 12.2% by the end of the year, GDP fell by 0.5%, unemployment went up to 5.6%, and the stock market fell by 46% from its most recent peak. See Figure 1 below.
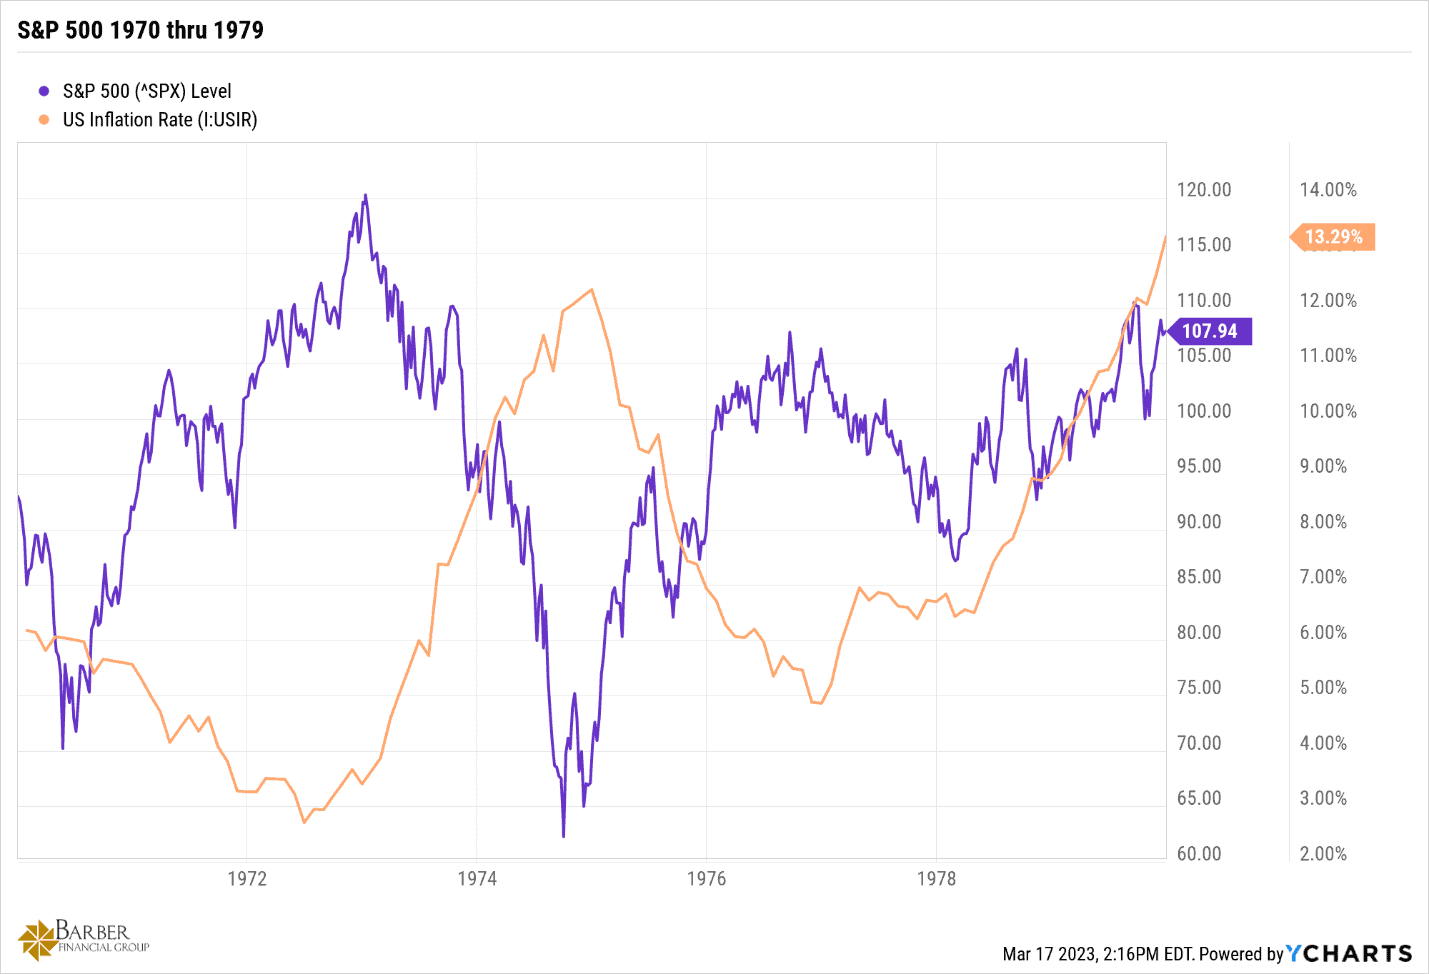
FIGURE 1 – S&P 500 1970-1979 – YCharts
Inflation Remained Persistently High
Between March 1973 and July 1974, in reaction to the rapid rise in inflation, Burns and the Federal Reserve Board raised the Fed Funds rate to 12.9% in an attempt to stave off inflation. However, the economy was in recession by July 1974, so they reversed course, reverting to much more accommodative monetary policy to get the economy restarted. Rates went all the way down to 5.2% by May 1975, and stayed at or below that level for the next two years.
By March 1975, the recession officially ended. Unfortunately, inflation had not. Though it was falling throughout the year, inflation remained persistently high. January’s reading was 11.8% and December’s reading was just below 7%. The annual rate of inflation for 1975 was 9.1%, up from 1974’s 8.5% annual rate. Unemployment also went up to 8.5%
Figure 2, below, is a little busy, but you can see how inflation, the stock market, and unemployment fared throughout the 1970s.
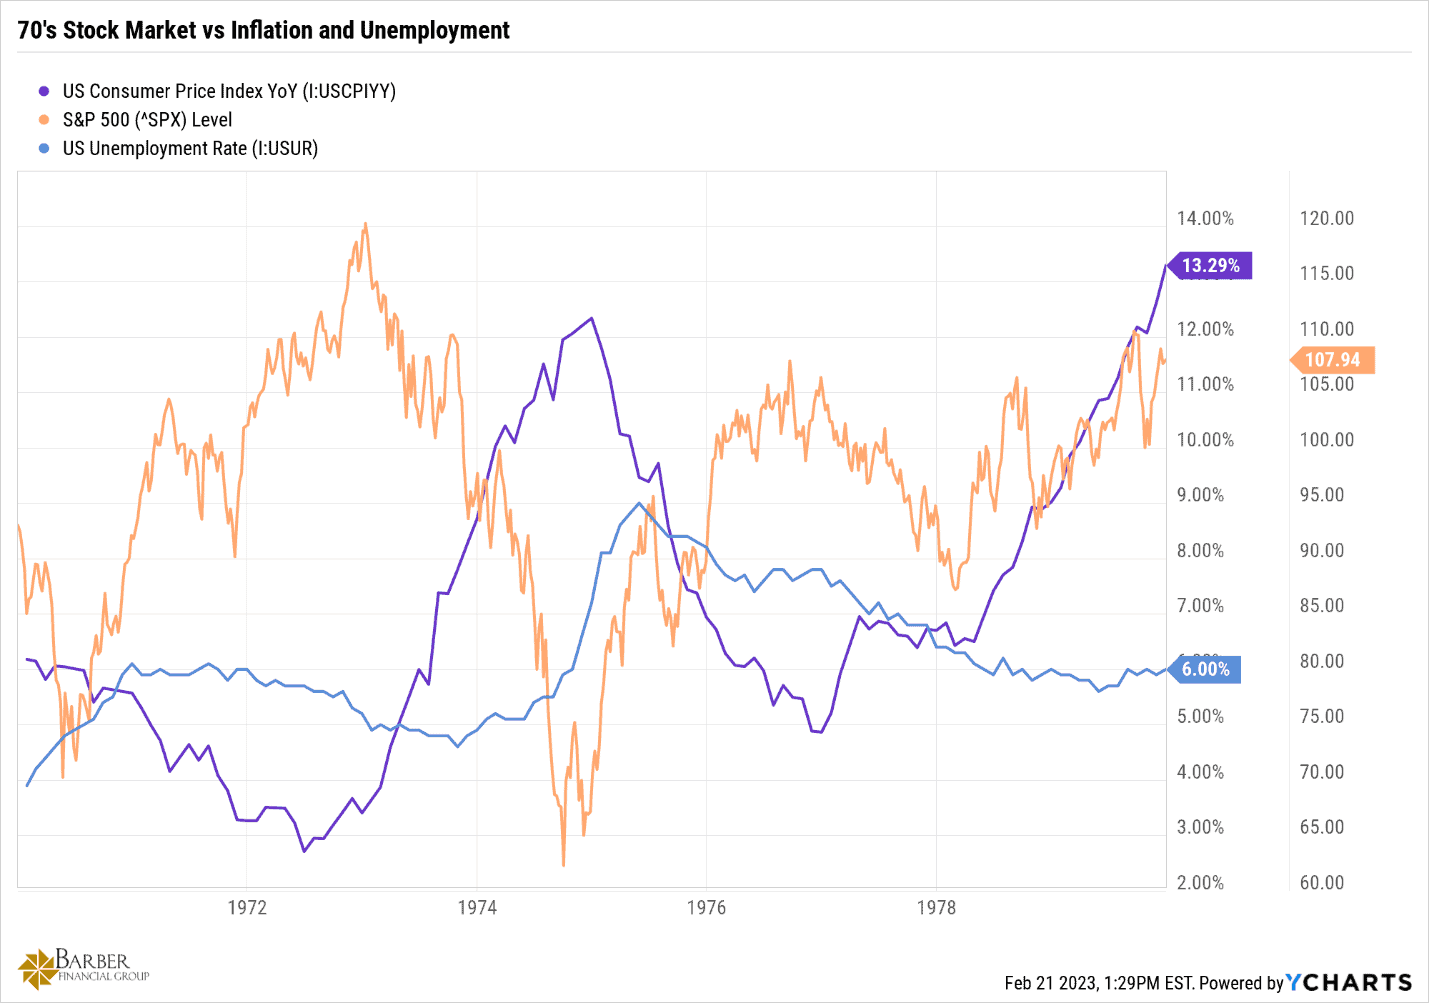
FIGURE 2 – 1970s Stock Market vs. Inflation and Unemployment – YCharts
Then, Figure 3 shows how much high rates of inflation erode GDP over time.
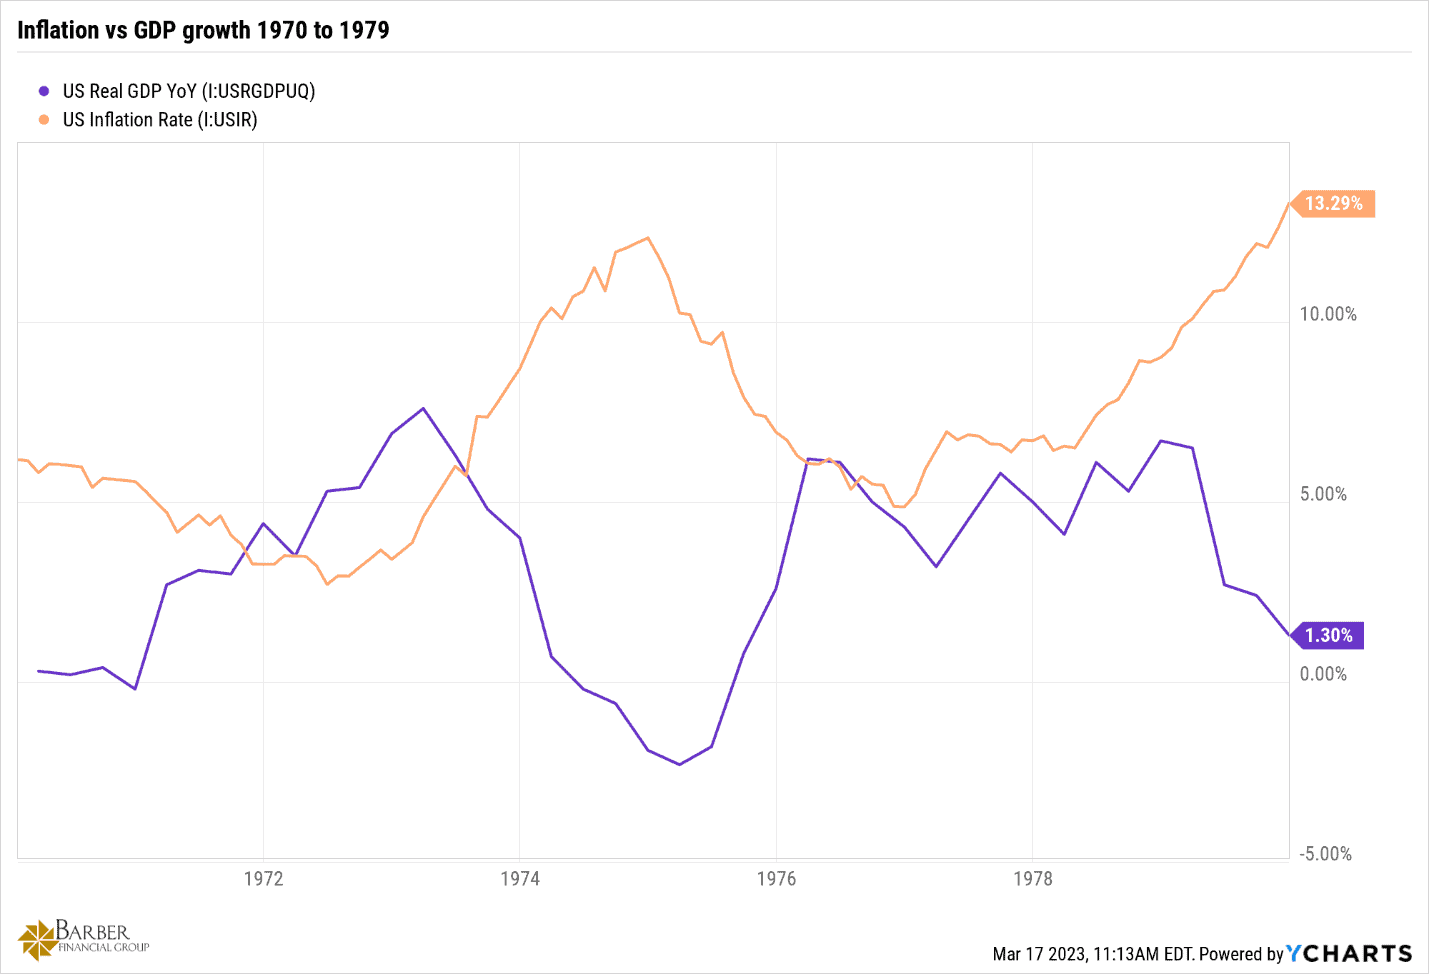
FIGURE 3 – Inflation vs. GDP Growth from 1970 to 1979 – YCharts
The higher prices cause people to be choosy about where and how they spend their money because they have less disposable income for discretionary spending as prices for essential items rise. That suppresses demand and therefore the need to produce those discretionary items in the same quantities as before. Which leads to layoffs and further erodes GDP due to the loss of income of those laid off individuals when the layoffs occur on a wide scale, as they do in times of economic turmoil.
An Abundance of Outstanding Loans to Third World Countries
In 1975 in Washington D.C., Congress was holding hearings discussing the concerns they had over the amount of loans to third world countries and their possible threat to the capital position of banks. At that time, eight of the largest U.S. banks had $38 billion of those loans outstanding. That’s the equivalent of roughly $270 billion in today’s dollar. No wonder they were concerned. Meanwhile, 230 miles to the north, the city of New York was on the verge of bankruptcy due to extreme mismanagement. They asked the Federal Government for a bailout, and President Gerald Ford declined their request.
Ultimately though, he changed his mind after the geniuses in charge in New York indiscriminately raised taxes and cut programs, causing unrest among the natives. Ultimately, they obtained a $2.3 billion short-term loan from the government. The same government worried about risky loans to third world countries. Makes sense.
Setting the Stage for the Savings and Loans Crisis
While we’re on the subject of loans, the Home Mortgage Disclosure Act of 1975 (HMDA) also came onto the scene. It became the precursor to the savings and loans crisis that came along in the late 1980s. It does what its name says and requires banks and S&Ls to document their lending practices. However, it also “encourages” banks and S&Ls to lend mortgage money in low-income areas. What could possibly go wrong? As we know now with the benefit of hindsight, a lot!
On September 15, 1976, American Bank and Trust Company failed. It was the fourth largest bank failure in history at the time. The story of the bank’s failure is something out of a movie. The family that owned the bank had funneled over $40 million to themselves through a maze of transactions over the course of months that eluded regulators…right up until they didn’t. But the owner allegedly “died” in a Mexican plane crash and the rest of the family disappeared.
The Community Reinvestment Act Offers False Hope
1977 saw the lowest unemployment number that we had seen in a while, with unemployment falling to 7.1%. GDP had reasonable growth of 4.6%, and inflation was a relatively tame 6.3% annualized. 1977 also brought us another gem of a regulation. It was called the Community Reinvestment Act (CRA). Directly from the Board of Governors of the Federal Reserve System, here’s how they describe the act.
“The Community Reinvestment Act (CRA), enacted in 1977, requires the Federal Reserve and other federal banking regulators to encourage financial institutions to help meet the credit needs of the communities in which they do business, including low- and moderate-income (LMI) neighborhoods.”
The unintended consequence of achieving the goals of the CRA, i.e. getting loans to people who may otherwise not qualify for a mortgage, was that many of those people were given false hope. There was no way they could afford the mortgages they were given. They ultimately wound up in a worse position than the started from.
Sadly, the incentive to reduce lending standards contained in the act and subsequent legislation ultimately led to the housing crisis of 2005-2009 and the financial decimation of far too many families and individuals.
Troubling Times in the Middle East
Unrest was afoot in the Middle East in 1977. The pro-western Shah of Iran was coming under pressure from all sides in articles and open letters published from January to July of that year, criticizing the accumulation of power into the hands of one man. His 1977 visit to Washington, D.C., in November was disrupted by Iranian students protesting him. The police had to use tear gas to stop the protests. President Jimmy Carter at that time described Iran as an island of stability in the Middle East, which was/is one of the most troubled areas in the world.
That island of stability was about to fall. The Iranian revolution was now fully underway. Protests, strikes, and mass killings were daily events throughout 1978. By the end of 1978, the Shah had all but ceded his reign, and in January 1979 he and his family left the country for Egypt for a “vacation.” The Shah reportedly told newly appointed Prime Minister Bakhtiar as he left, “I give Iran into your care, yours and God’s hands.” Two weeks later the Ayatollah Khomeini returns to Iran and chaos ensues. Two weeks following the return of the Ayatollah the U.S. Embassy in Tehran is attacked and the Iranian hostage crisis that would last for the next 444 days began.
Oil Prices and Inflation Take Off
Iranian oil production would be cut by 4.8 million barrels a day due to strikes in Iranian oil fields, representing 7% of worldwide production at the time. Oil prices would skyrocket again, rising from $13 dollars a barrel in mid-1979 to $32.50 per barrel by the end of the year.
Not surprisingly, inflation took off again too. By December 1979, inflation reached 13.9%. Inflation finally peaked in 1981 at 19.1%. Then Fed Chairman Paul Volcker temporarily raised the Fed funds rate to 21% to get it under control. His theory was that you must get the Fed Funds rate higher than the rate of inflation to control it. It worked. By 1983, the annual rate of inflation had dropped to 4%. The problem was that the incredibly high inflation of the late 1970s and early 1980s had taken its toll on the unemployment rate. By 1982, unemployment peaked at an annual rate of 9.7%, and 1982’s GDP was a negative 1.9% annualized.
How the Lost Decade Came Full Circle
At the end of 1979, investors had very little to show for the dramatic volatility that they endured in the preceding 10 years. Very little indeed. The return of the S&P 500 for the period January 1, 1970, to December 31, 1979, was 16.06%. See Figure 4 below. That’s a measly 1.6% per year return. And if you add inflation back to the equation they were negative on an annual basis over the trailing 10 years. Hence the term lost decade. There was no reward in the 1970s for a holding the S&P 500 for 10 years and riding out the ups and downs.
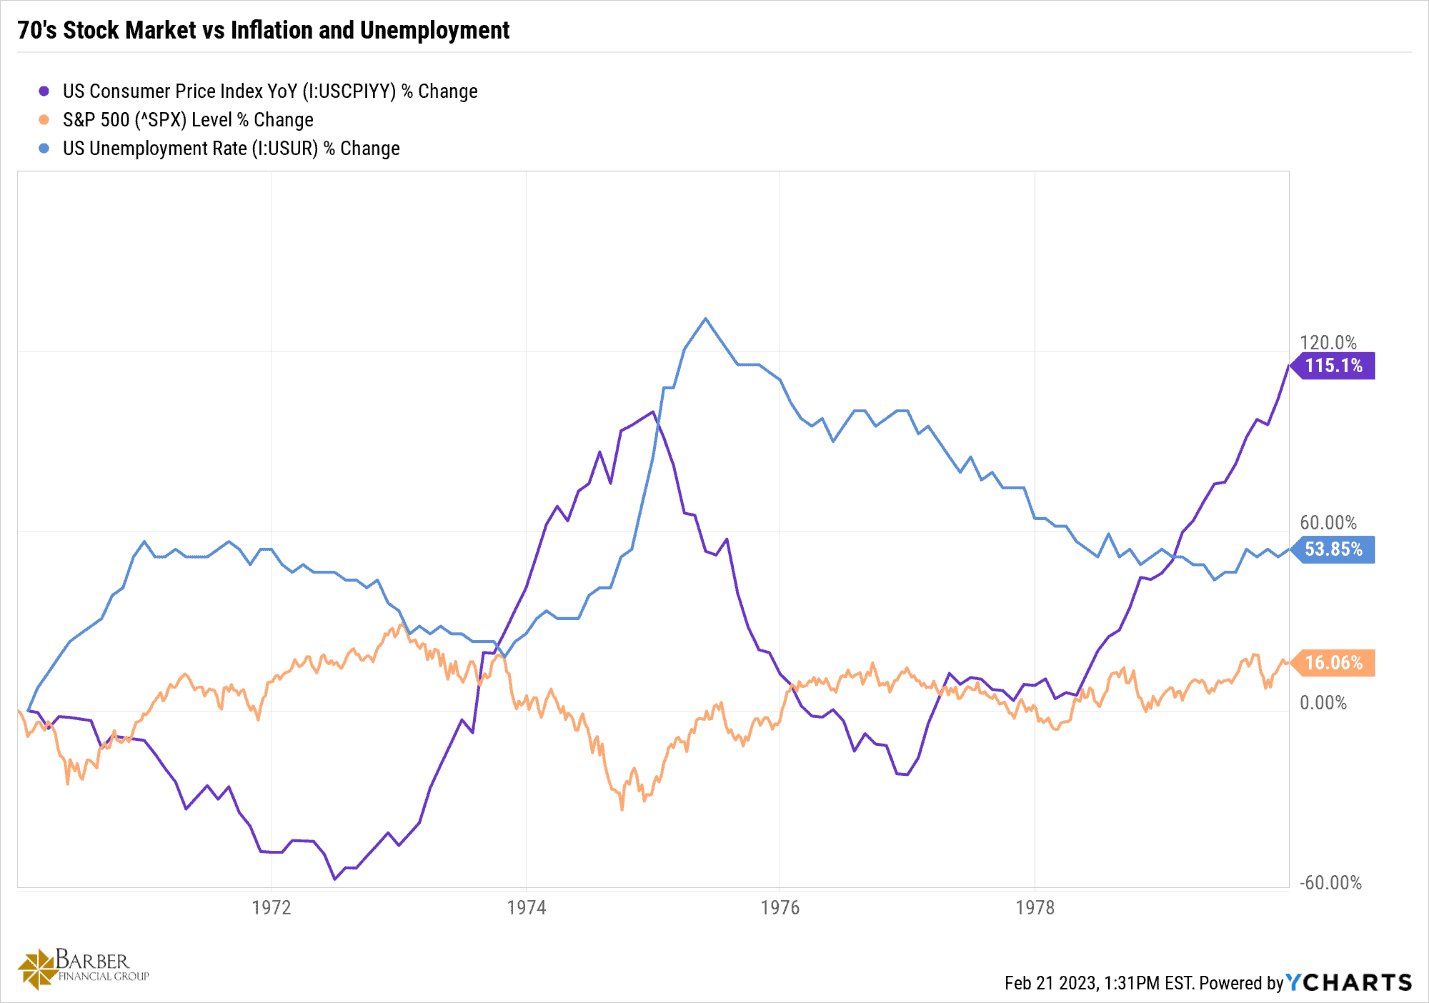
FIGURE 4 – 1970s Stock Market vs. Inflation and Unemployment – YCharts
Then, Figure 5, shows the inflation-adjusted return for the S&P 500 from 1970 through 1979. It’s not pretty. Lost decades can and do happen. And they blow the lid off the assumptions that you will make 7% per year in equities over any 10-year period. To borrow a phrase from Ronald Reagan, it’s not that the people who say that are stupid; it’s just that they know so much that isn’t so.
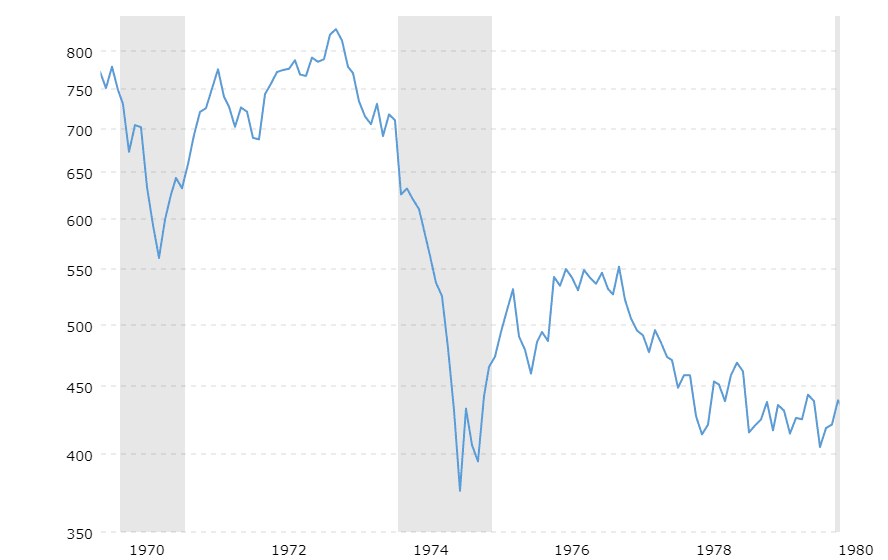
FIGURE 5 – Inflation-Adjusted Return for the S&P 500 from 1970 through 1979 – YCharts
More Research on Lost Decades
There’s so much more to the story of the lost decade of the 1970s than I can fit in the confines of an article. If you’d like to continue researching the lost decade of the 1970s, here are a few links that can help get you started.
- Brookings: What “Lost Decade?”
- Watch: The Lost Decade of Investing Is Coming (and How to Prepare)
- MarketWatch: Forget 60/40 Portfolio. This Simple Strategy Could Be the Key to Making Money in All Markets.
- Listen: How to Stay Wealthy During a Lost Decade
- Finance Magnates: Here’s Why Analysts Are Warning of a “Lost Decade” for Public Equities
Looking at the Parallels from the 1970s and Present Day
Recapping many of the events that played a role in the lost decade of the 1970s and the charts that backed it up probably made a light bulb come on in your head. There’s a reason I titled this article, Lost Decade of the 1970s and Why It Still Matters. The lost decade of the 1970s has a lot of parallels to what we’re currently experiencing and forecasts what could be in store going forward.
Let’s compare a few of the charts I’ve already shared from the 1970s to charts with data from the past few years. We’ll start with comparing the data from Figure 2 to the data below in Figure 6 that highlights the S&P 500’s performance against inflation and unemployment rates.
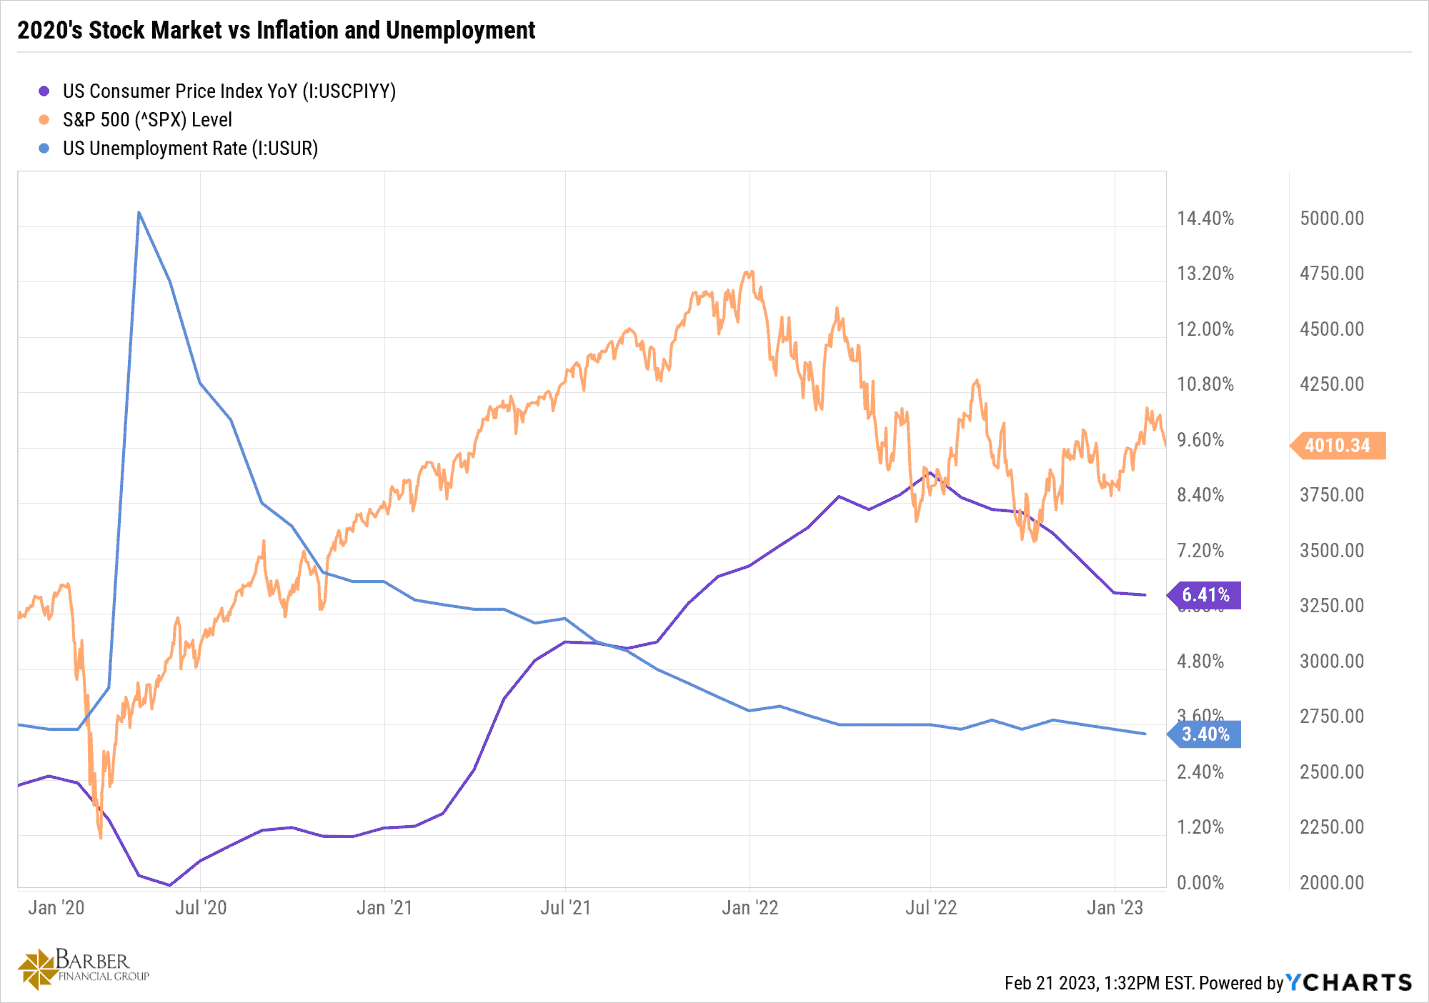
FIGURE 6 – 2020s Stock Market vs. Inflation and Unemployment – YCharts
Next, look back at Figure 3 and compare it with Figure 7 below to see a then-and-now of the inflation rate versus GDP growth.

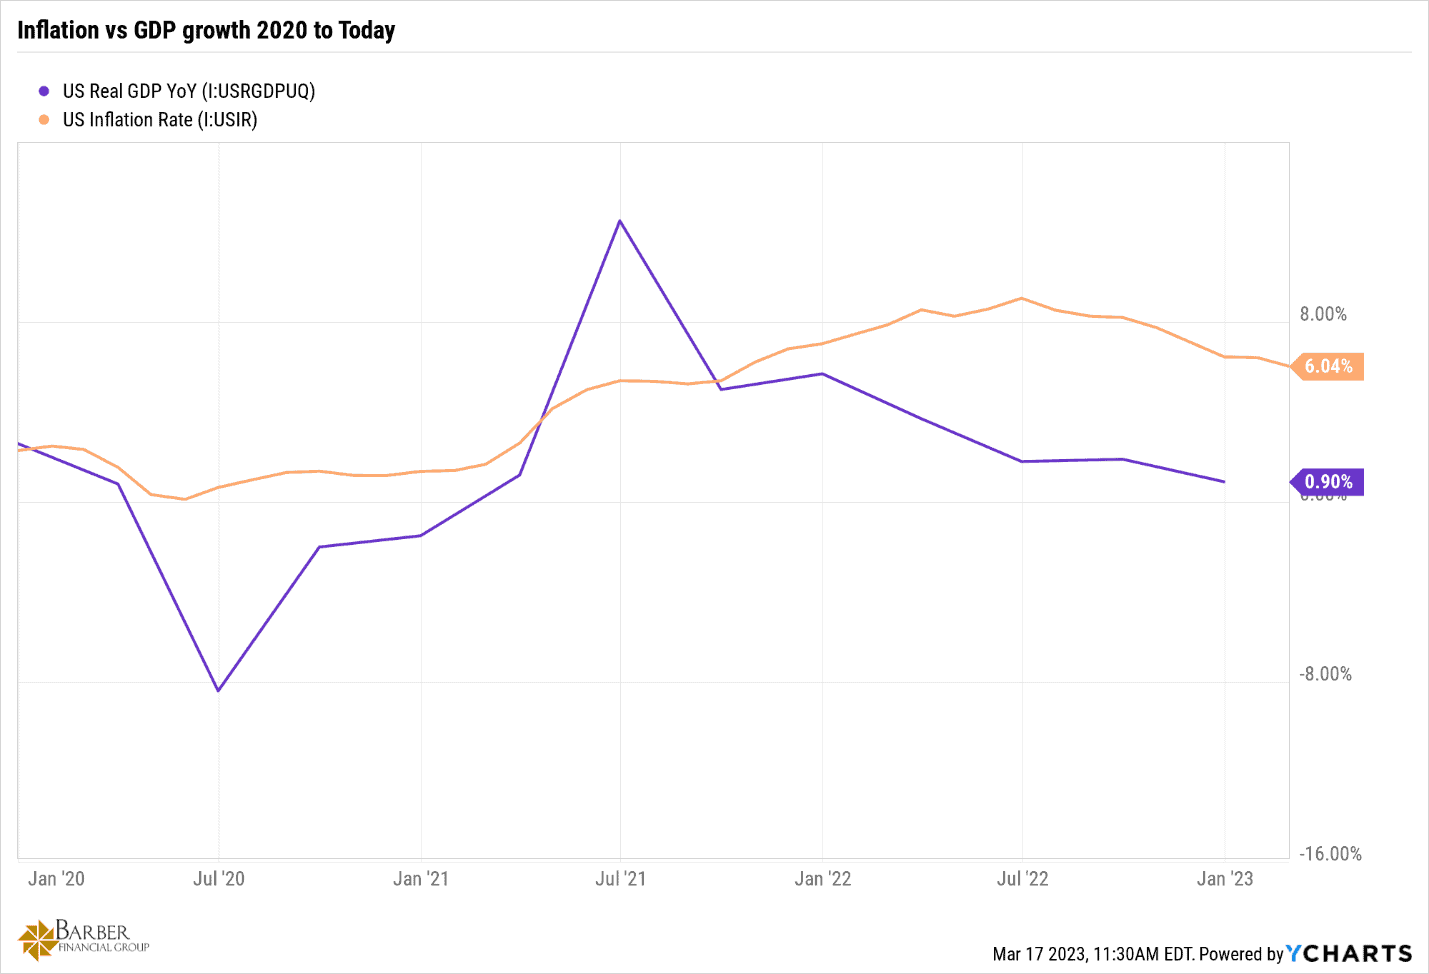
FIGURE 7 – Inflation vs. GDP Growth 2020 to Today – YCharts
Now, we’ll look back at Figure 8 below and see how it stands up to Figure 4 in terms of the S&P 500’s change over the 1970s compares to what we’ve seen so far in the 2020s.
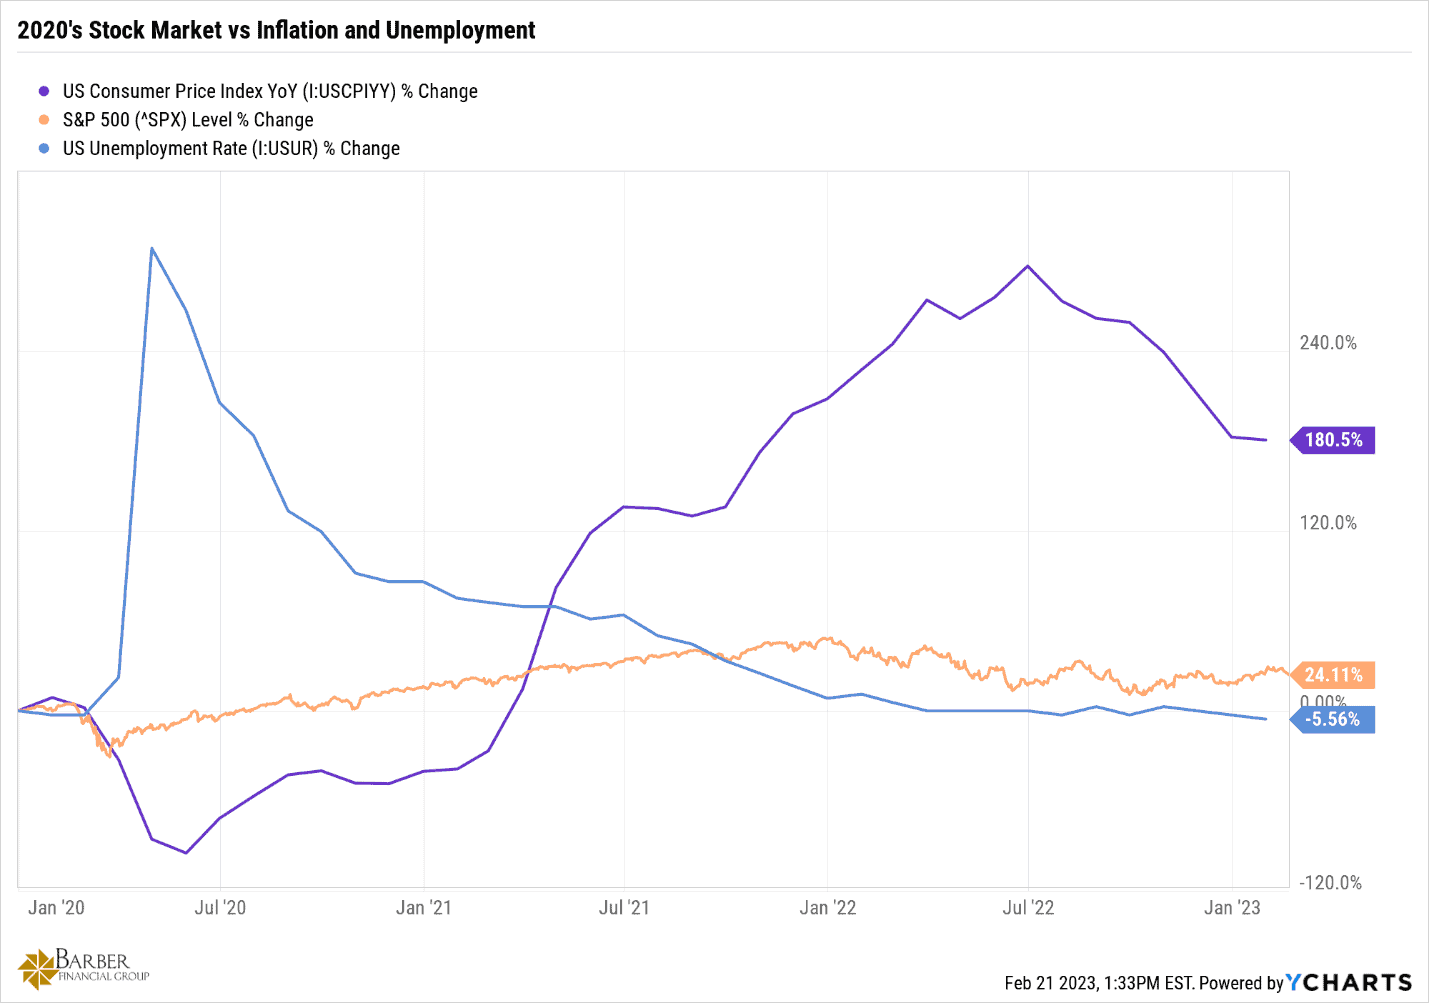
FIGURE 8 – 2020s Stock Market vs. Inflation and Unemployment – YCharts
Lessons Learned from the Lost Decade of the 1970s
I’ve really enjoyed taking this little trip back in time, though. In my mind these last few days, my brothers and I are still young. We’re riding bikes all over town, playing with GI Joes and firecrackers in the drainage ditch, swimming at the YMCA, and playing basketball in the driveway and football in the street with the neighbor kids.
But, alas, I’m not young anymore. But I am wiser, and for that I’m thankful. And that was/is the point of this whole exercise; to find the lessons of the lost decade of the 1970s and take some wisdom away from it.
A Laundry List of Lessons
First, wonderful technological advances can come even in times of economic difficulty.
We learned that the light at the end of the tunnel isn’t always a train. And that “this too shall pass,” as the two decades that followed the 1970s brought us the longest bull market run in history.
We learned that monetary policy from the Fed can work. And we learned that monetary policy from the Fed can be harmful if left too easy too long.
We learned that well-intentioned government policy doesn’t equal good government policy. Regulators can and do fail us. Sometimes due to negligence, sometimes due to funding or staffing issues.
We learned that there are forces in this world that are out of our control can derail the best laid plans if we don’t have contingencies in place.
Another important thing we learned is that energy policy, and cheap reliable access to energy, is vital to our economy, livelihoods, and standard of living.
We learned that reliance on others for the things that we can and should produce for ourselves is economic suicide.
We learned that inflation and GDP growth have an inverse relationship.
That’s a lot to learn from a “lost decade,” but I’m not quite done yet. We learned that the theories of modern portfolio theory are just that, theory.
And we learned that there is no substitute for paying close attention to the economic events of the day, analyzing them honestly, and making well-reasoned and rational decisions based on those analyses.
Scared Money Don’t Make Money
Last, but certainly not least, we learned ultimately that a successful retirement in a lost decade requires planning, contingencies, thoughtful and sober analysis, and a willingness to act when the current conditions warrant it. In the words Florida football coach Billy Napier, “Scared money don’t make money.”
Overcoming the economic uncertainty we’ve been dealing with takes a lot of discipline. The first step in doing so is to create a financial plan that gives you clarity and confidence so you can live your one best financial life. It needs to be a plan that incorporates your goals for retirement and is unique to you.
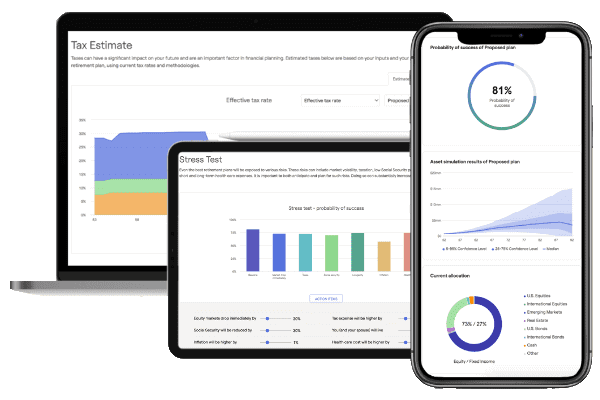
What’s Your Probability of Success?
You can start building your plan today with our industry-leading financial planning tool. Our tool helps you determine your probability of success of your retirement. Your probability of success looks at your situation from a historical perspective, and states that you can do everything you want to do X% of the time, and never need to adjust your spending. So, your plan is being stress-tested against periods like the lost decade of the 1970s to see if you can retire successfully. You can get a much better idea of what that looks like by clicking the “Start Planning” button below.
How Much Do You Need to Retire?
As I much earlier, this is a lot of information to consume in one article, and I could’ve included a lot more! Planning for retirement isn’t something that someone should do on their own. A team of professionals that’s working for you can ensure that you live your one best financial life, even in times that compare to the lost decade of the 1970s. If you’re constantly asking yourself the question, “How much do I need to retire?” our team can help you with that.
Whether you’re asking yourself that or more specific questions pertaining to retirement, you can ask away during a 20-minute “ask anything” session or complimentary consultation with one of our CFP® Professionals. We can meet with you in person, by phone, or virtually depending on what works best for you. And it’s all at no cost or obligation. We look forward to hearing from you.
Investment advisory services offered through Modern Wealth Management, LLC, an SEC Registered Investment Adviser.
The views expressed represent the opinion of Modern Wealth Management, LLC, an SEC Registered Investment Adviser. Information provided is for illustrative purposes only and does not constitute investment, tax, or legal advice. Modern Wealth Management, LLC does not accept any liability for the use of the information discussed. Consult with a qualified financial, legal, or tax professional prior to taking any action.