Inflation and Supply Chain Issues Are Intertwined
Key Points – Inflation and Supply Chain Issues Are Intertwined
- The Latest on Inflation as We Begin 2022
- Shane Shares His Supply Chain Experience
- Going Back to Econ 101 with Supply and Demand
- Inflation As It Relates to High Home and Gas Prices
- Explaining Supply Chain Troubles with the Process of Pencil Making
- 20 Minutes to Read
The Latest on Inflation as We Begin 2022
So much has been written about inflation over the last several months, including by myself, that it might seem as if there’s nothing left to discuss. However, the debate about what’s causing it continues to rage among those who study the economy.
There are several sides to the causation argument. One side believes the inflation we’re seeing is due to an explosion in consumer demand that has far outstripped our ability to meet it. Others see the supply chain disruptions that began in the early days of the pandemic, and persist to this day, as the culprit. Some people are convinced that the Federal Reserve’s easy money policies have caused the inflation to occur, and some are convinced that it’s our high level of federal debt that is the cause.
Our Inflationary Reality
The reality is that rational arguments can and have been made by intelligent individuals to support all these positions. Nevertheless, time and evidence have a way of making otherwise reasonable positions seem less reasonable as they unfold.
Today, we’ll take a deep dive into what time and evidence are saying about our current battle with inflationary pressure. My goal is to provide a glimpse of how we can get inflation under control.
From a historical perspective, rising prices and cost of living are nothing new. We all hope that our homes increase in value over time so that we can sell them for more than we bought them for when we’re ready to move on. That is inflation in its simplest form.
Today, those who bought homes prior to the pandemic are seeing incredible increases in the value of their property. It’s great for them, but not so good for the people who are trying to get into a home. The type and size of home they are looking at becomes less affordable each day. Increased borrowing rates, which may be coming, will only exacerbate that problem. Look at Figure 1 to see how fast the average home price has increased.
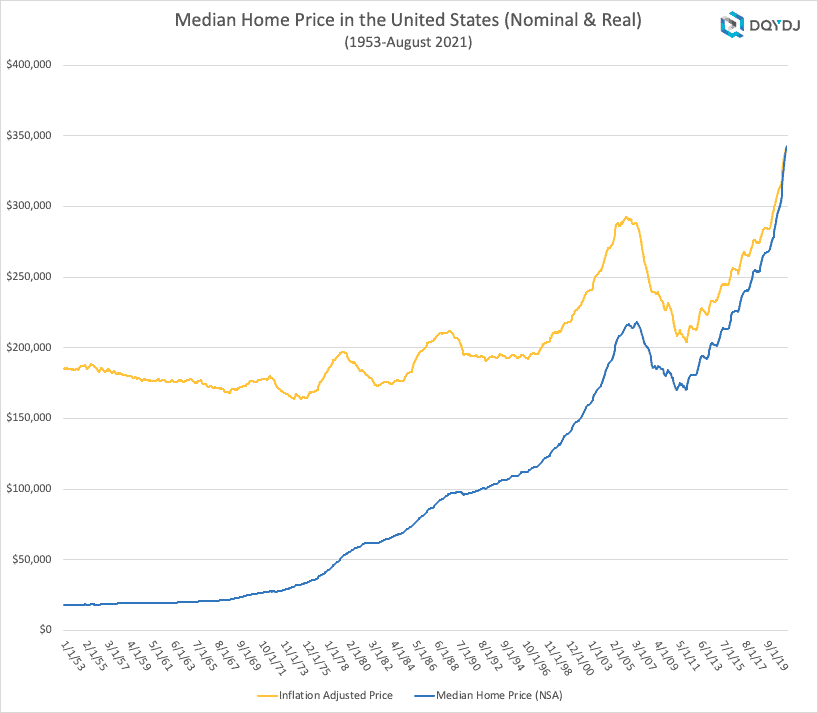
TABLE 1 | Median Home Price in the United States (Nominal & Real) | DQYDJ
A History of Home Prices
In 1970, the average price of a home was just about $26,000. By 1990, the average price had jumped to $96,000. By the last peak in home prices in May 2007, the average price was $218,000. This represents almost a 10-fold jump in 37 years.
After the financial crisis, prices fell dramatically and remained below the 2007 peak until April 2016. That’s when the average home price finally got back above $218,000. Today, just six years later, the average home price is $343,000, which represents a 57% increase.
My guess is that very few people had a 57% increase in their wages over the last six years, which means that what they can afford in a home today is significantly different than what they could have bought just six years ago. What is causing the rapid appreciation in home values? Is it simply demand or is there another force at play here?
It’s Not Just Home Prices That Are Sky Rocketing
If it were only home prices increasing like this, the only people who would be worried are those on the outside looking in wishing they could buy a home. But it’s not just homes as we’re all painfully aware. Used vehicles, of all things, have been appreciating in value at levels formerly reserved to collector cars. Check this out in Figure 2.
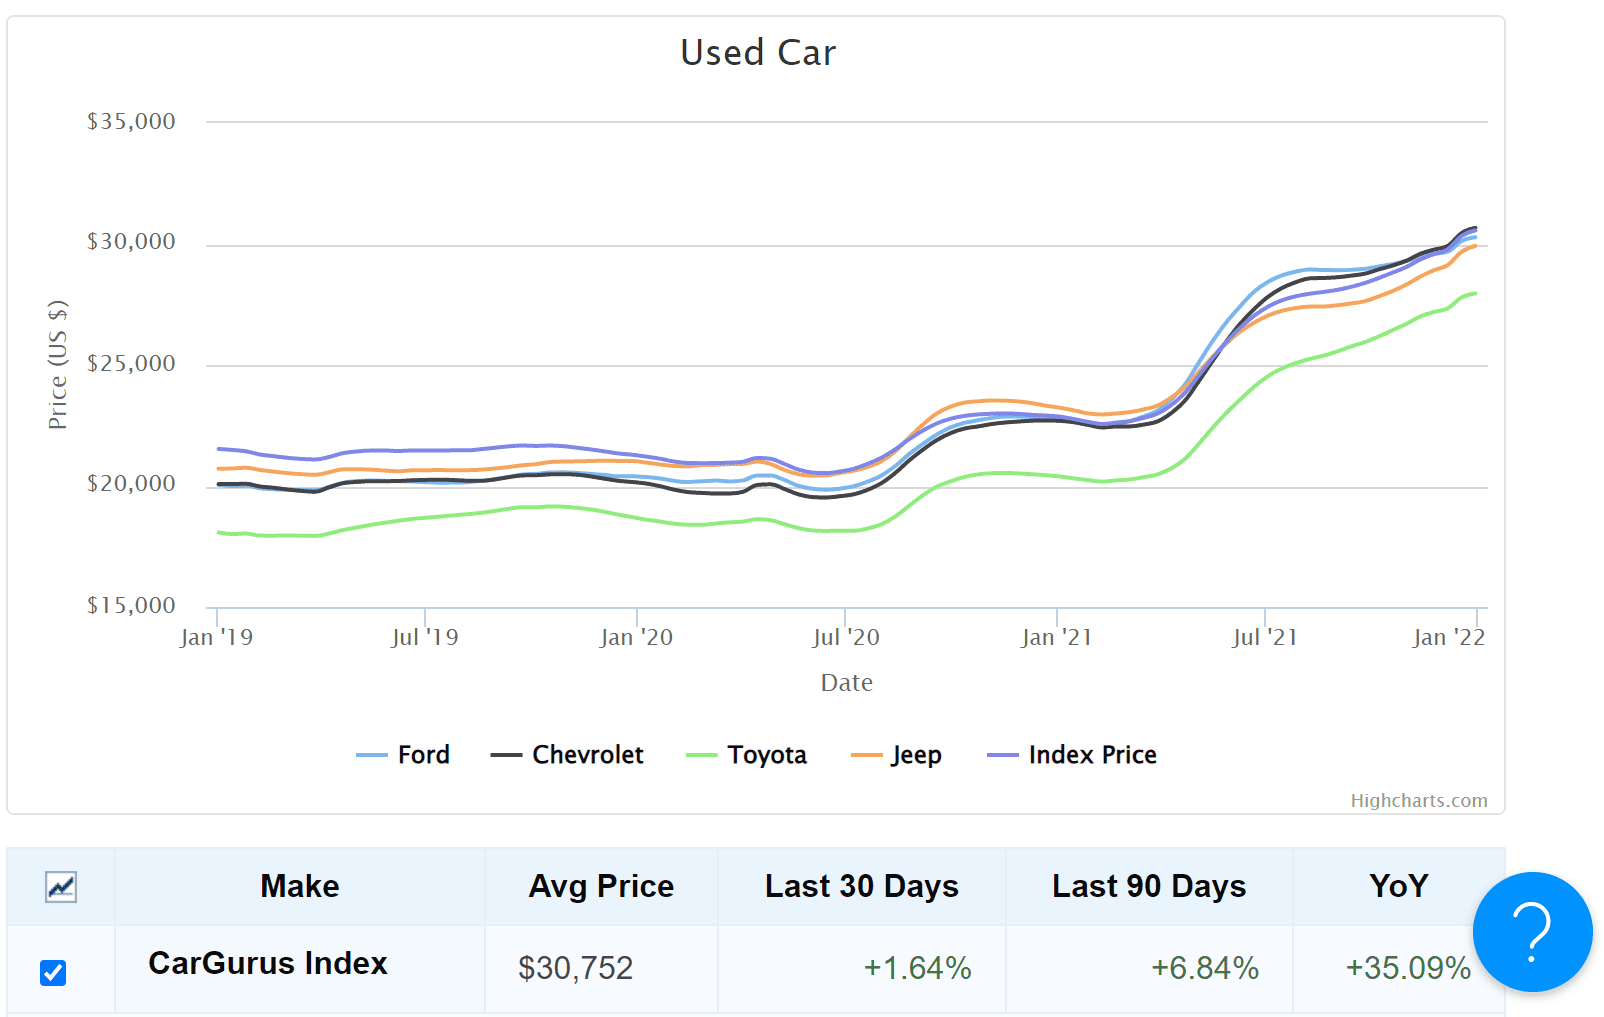
TABLE 2 | Used Car | CarGurus Index
The average price for a USED vehicle is up 35.09% over the last year! This is unusual to say the least. Can it simply be that there’s so much demand for used cars that they are increasing in value? Or is there another reason here, too?
I suspect that many of you know the answer to these questions instinctively. The rapid increases in home values and the prices of used cars are NOT solely due to demand. In fact, in the case of used cars, it’s not due to demand at all—at least not in the normal way we think of demand. In the case of the used vehicle prices, the demand is artificial.
Microchip shortages are causing huge delays in new vehicle deliveries, which is causing the demand for used vehicles to be artificially inflated because new vehicles are harder to come by. This won’t last forever, but it is happening now. So, for now, used vehicles are worth more.
The Supply Chain: The Culprit of These Crazy Price Increases & Inflation
So, what IS the driving force behind the price increases we’re seeing throughout the U.S. and global economies? In my opinion, it all boils down to one word: supply. To be more specific, it is the supply chain which has been in a constant state of disruption since March 2020 that has caused most, if not all of the price increases we’re dealing with today.
To be sure, there are plenty of supposed “experts” who parade around on television telling us that inflation is all due to unprecedented demand. Those “experts” say that we should just get used to the fact that things are going to be harder to get and that it will cost more when we can find them.
But is that so? Most of these so-called experts have never spent any time outside of a newsroom or academia and couldn’t explain the supply chain to you on a bet, let alone how failures in the supply chain can have huge ripple effects throughout an economy.
My Personal Supply Chain Experience
I spent 20 years in the industrial distribution world—running around manufacturing plants, food processing plants, power plants, distribution centers, and the like. I was there for the implementation of things like JIT deliveries and lean inventories in plants throughout the Midwest. I’ve seen how improved efficiencies from these types of programs can also create vulnerabilities and believe we’re currently seeing those vulnerabilities laid bar.
When Just in Time…Isn’t
The seeds of the damage from the disruption we’re experiencing in our supply chain were unwittingly planted decades ago by Toyota when it implemented the Toyota Production System. The TPS was the combination of Just In Time manufacturing processes with the inventory card system known as KANBAN that was invented by Taiichi Ohno, who was an engineer at Toyota.
Years later, many of you will remember that the whole world was enamored with the Japanese management model. The TPS and the adoption of any number of variations of the JIT model by U.S. and global companies was widespread.
Manufacturing plants, food processing plants, power plants, and product assembly plants went from having storerooms packed with parts just in case to wanting those parts delivered to them just in time. This freed up capital for expansions and other purposes and made the facilities much more efficient.
It also made them much more vulnerable to outside forces that they couldn’t control. Namely, the continued flow of needed supplies to their locations, at exactly the right time, without interruption or delay.
Responsibility for proper inventories of necessary parts was pushed down to the suppliers, be they wholesalers or even manufacturers of said parts. Those wholesalers and part manufacturers were also trying to implement some form of reduced inventory programs themselves. Everyone wanted someone else to be responsible for filling their needs…just in time…so they could deliver on their commitments…just in time…so they could deliver their product to you…just in time.
The Supply Chain Is Only as Strong as the Weakest Link
Notice a problem here? The chain has a lot of links in it, some of which are very weak. The chain is only as strong as its weakest link. It’s cliché, but it’s a fact. We’re watching the links fail in real time. Today, just in time…isn’t.
The logistical issues with JIT are even more pronounced when you introduce the variable of distance. The farther the supply is from the point of use, the longer potential delays can last and more severe the disruption can become. And that’s just from one failure.
Add another failure somewhere in the chain and you multiply the problem. The result becomes a lack of supply of the finished product—whatever that product is—even if the shortage is artificial and temporary. The price laws of supply and demand begin to take hold, which you can see in Figure 3.
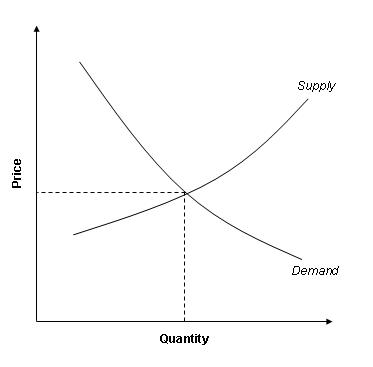
TABLE 3 | Supply and Demand
Going Back to Econ 101
Even in the face of historically normal demand, low supply will cause prices to rise. If demand is increasing, that will cause prices to increase faster, unless/until supply catches up to demand again. This is Econ 101 stuff. Well, at least it used to be before new math and feelings took over in academia, but that’s for another article.
What we are witnessing today is the inevitable fallout from over-reliance on suppliers who are too far away from the point of production. There is no Plan B for the type of disruption we’ve seen because of the pandemic.
Below in Figure 4, you can see the effects of supply on prices even as demand remains on its historical trend line. It’s important to note that prior to the pandemic, and even in the early days of the recovery from the darkest days of that time, prices were relatively steady. But the longer the supply chain disruptions remain, the worse the inflationary pressure becomes.
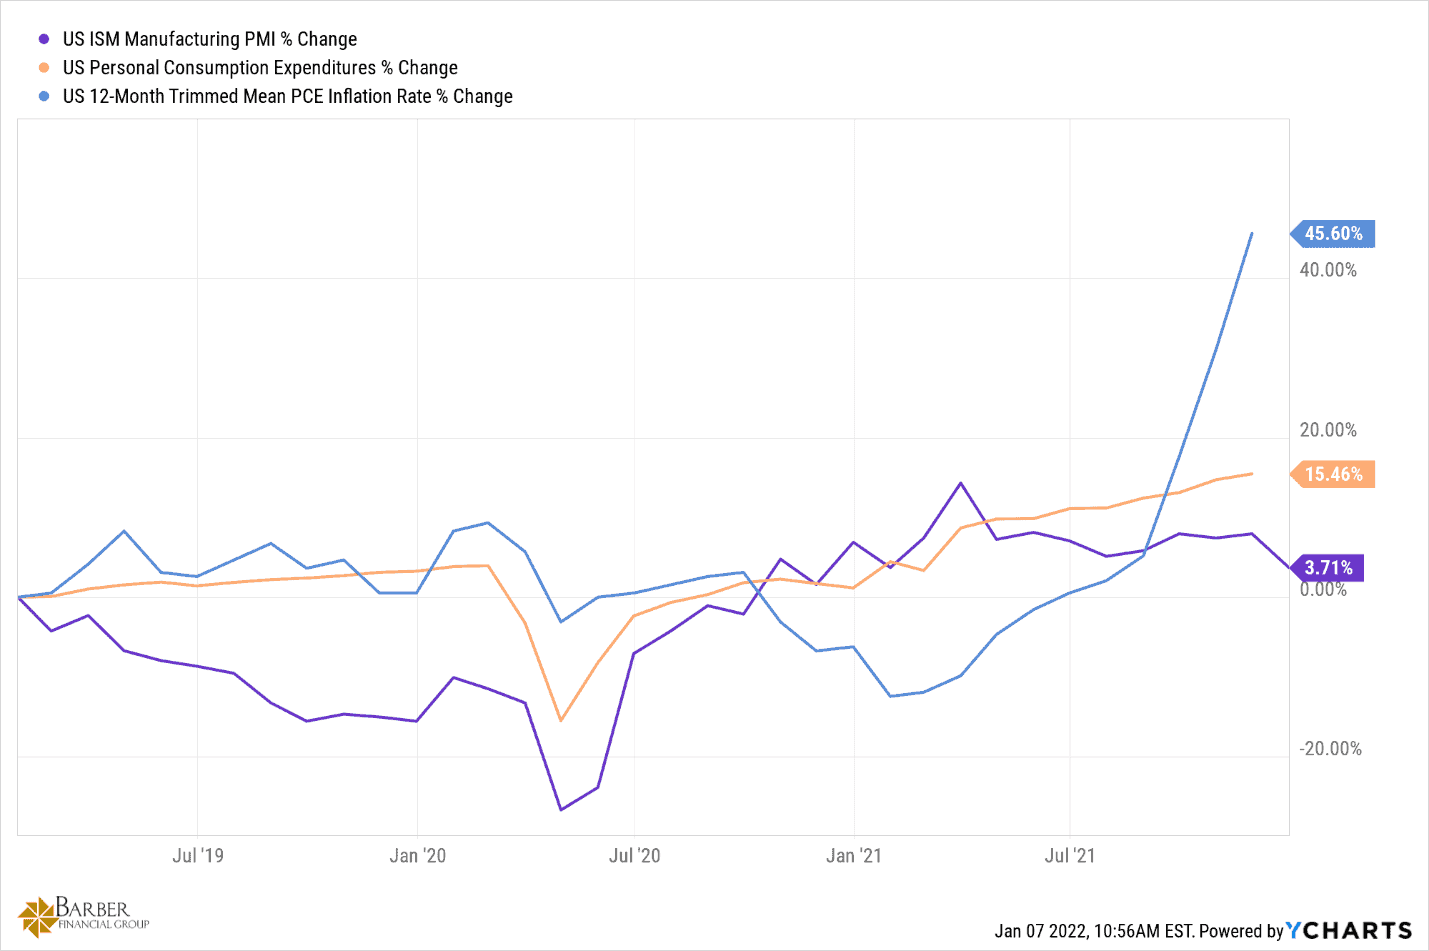
TABLE 4 | Personal Consumption Expenditures | YCharts
Figure 5 outlines that Personal Consumption Expenditures can only be thought of as having risen faster than at any time in recent memory. Just look at them from the bottom in April 2020 to now. The reality is that all they have done is go back up to continue the trend line they have been on for decades.
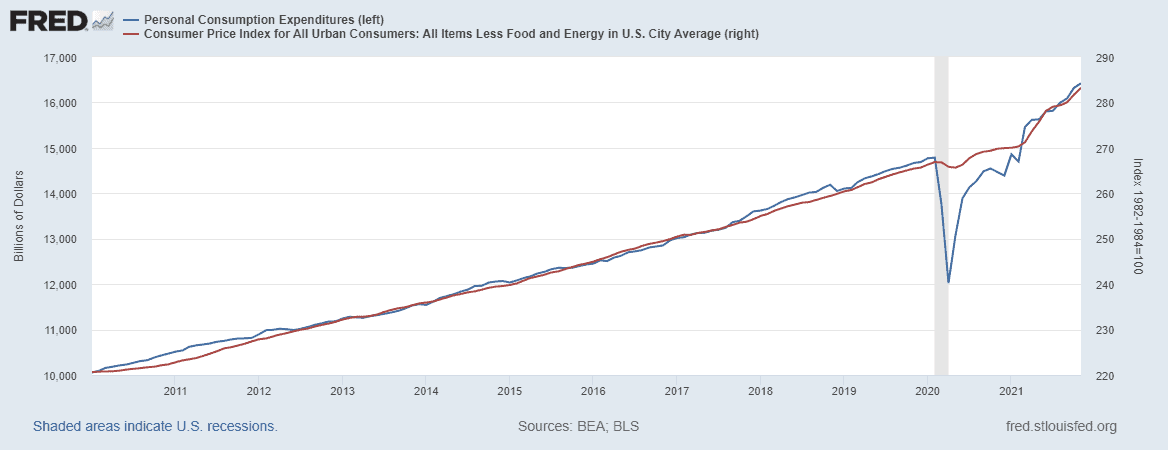
TABLE 5 | Personal Consumption Expenditures and Consumer Price Index for All Urban Consumers | FRED
The Desire Is There from The Manufacturers and Suppliers…
Every manufacturer or producer of goods on the face of the planet anticipated that line to continue prior to the pandemic’s onset, as did every economist worth his or her salt. The only people who didn’t see that happening were those who don’t understand how/why people spend money on the things they do based on their age and stage of life and the number of people doing those things in each generation. The manufacturers and producers WANT to get their products to the consumer. They also want to do it at the prices they were paying before the breakdowns in the supply chain.
The reality is that they are not benefiting from the shortage-induced price increases like you might assume. Increased transport and production costs don’t do anything good for their bottom lines. They also need to pass enough of those increased costs on to the consumer to remain profitable enough to be there when this is over.
…However, the Consumers Aren’t Confident
At the same time, they are suffering from an erosion of confidence in their customer base that they would prefer not to have to endure. Looking at the manufacturing in five regions measured by the Federal Reserve, you can see in Figure 6 that they are working to get supply out the door as fast as they can following post-pandemic panic.
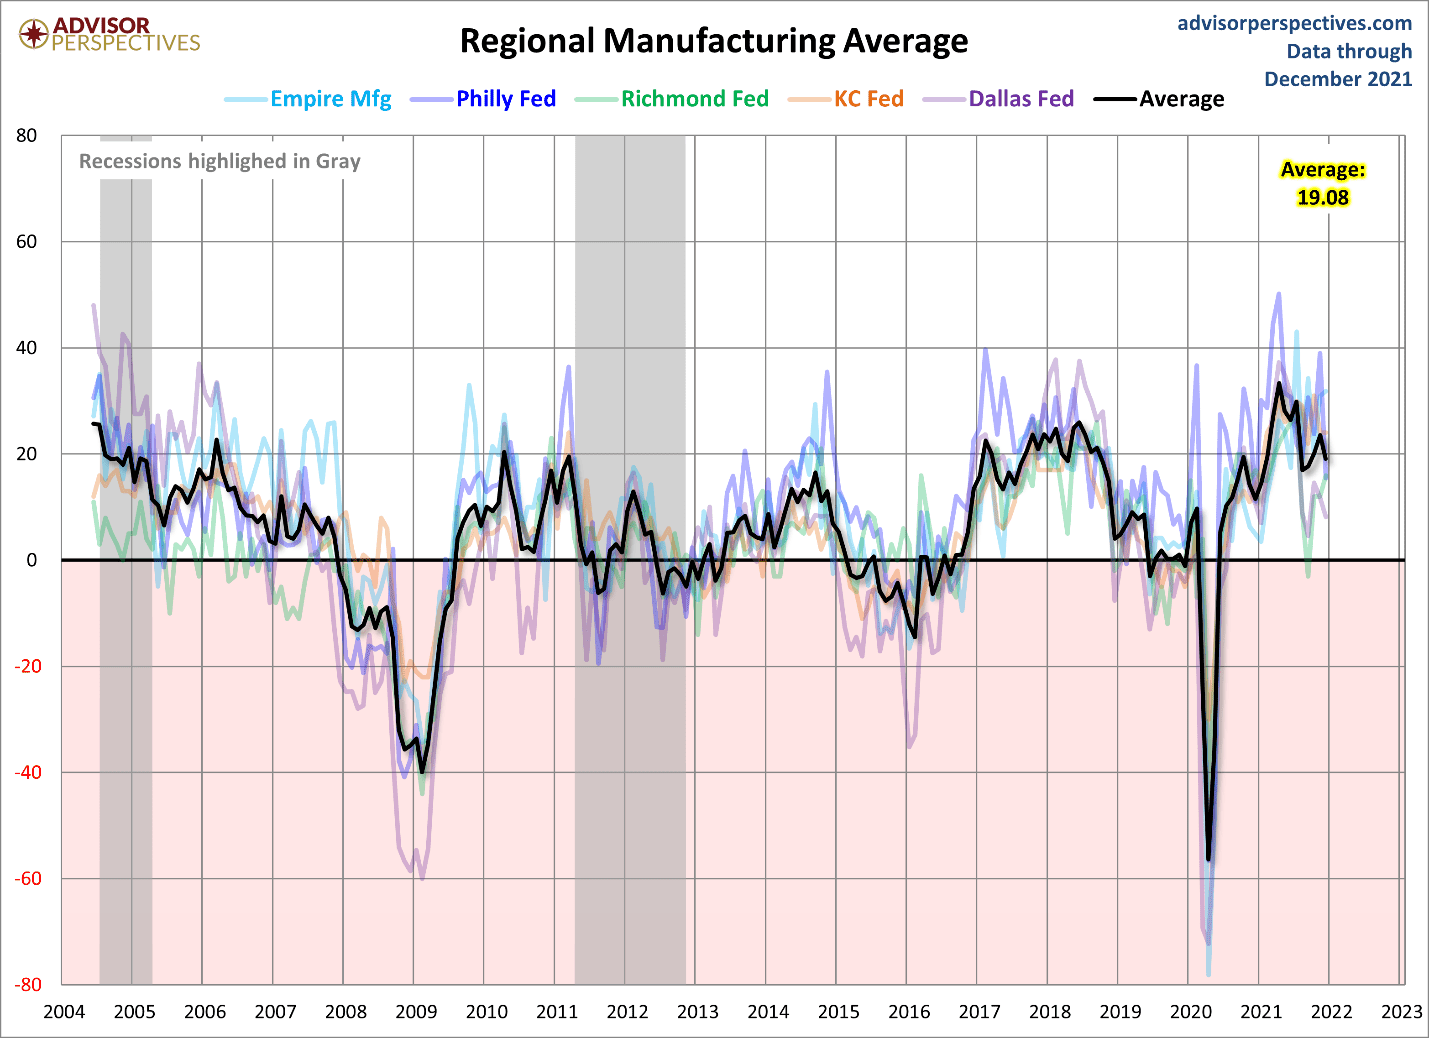
TABLE 6 | Regional Manufacturing Average | Advisor Perspectives
It’s worth noting the dip in 2020, especially since it’s so clear in Figure 6. This dip is universal in any economic metric you look at through that period. Where manufacturing and material production are concerned, It was the result of lockdown policies and misguided decision making about what consumers would do when forced to stare at the walls and each other for an extended period of time.
Have Money (and Time), Will Spend
Many, if not most, anticipated that the consumers would do nothing. The reality was quite different. They got online and spent money just like they would have if they were out and about. Ninety percent of people still had their regular income, and stimulus checks started rolling in too.
When you have money and a lot of time on your hands, they money is going to get spent. I guess those in charge of forecasting forgot about the digital economy for a minute.
Pain at the Pumps
Gasoline prices rose dramatically in 2021 as well. They contribute to the rise in consumer prices because everything you purchase requires some level of transportation. When fuel costs more, so does everything else.
The news media and the administration want you to believe that the gasoline price increases are due to increased demand post pandemic. They are either mistaken, misinformed, or lying, but either way they’re wrong. Gasoline consumption is not higher. In fact, it’s trending lower despite population growth that would suggest otherwise. Figure 7 highlights exactly that.
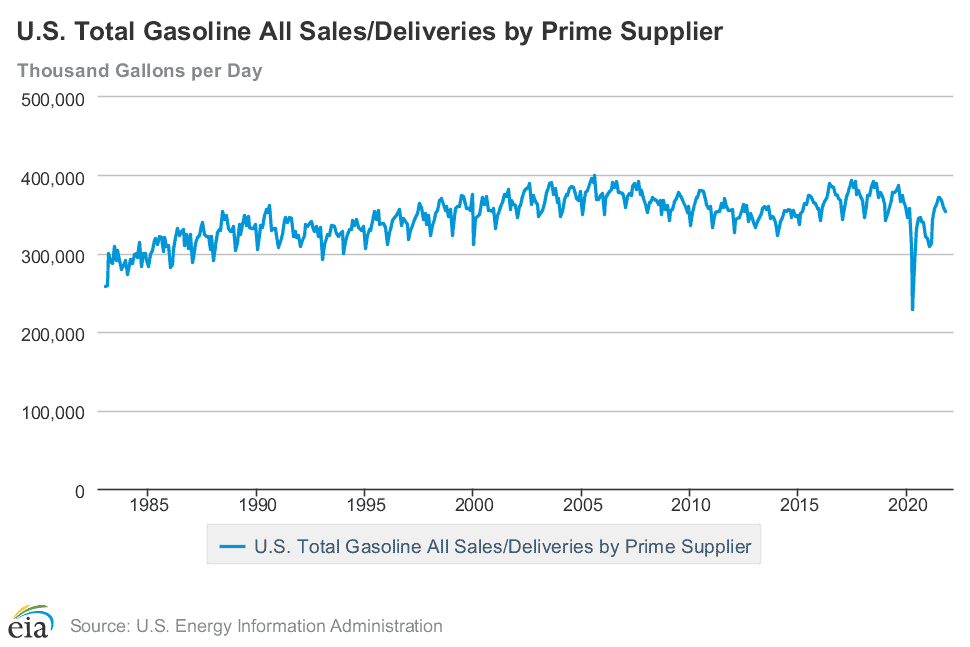
Gasoline usage peaked in 2005 and has trended lower ever since. It dropped off dramatically during the peak of the pandemic and then recovered yet again back to its previous trend, but not to new or unprecedented levels.
It’s the Same Supply Issue
Any assertion that demand is the reason for today’s high fuel prices is flatly false. It is a supply issue, just like everything else we’re talking about here. However, this supply issue was created in the halls of government via energy policy, and at the worst possible time.
Figure 8 is further proof of what I’m talking about here.
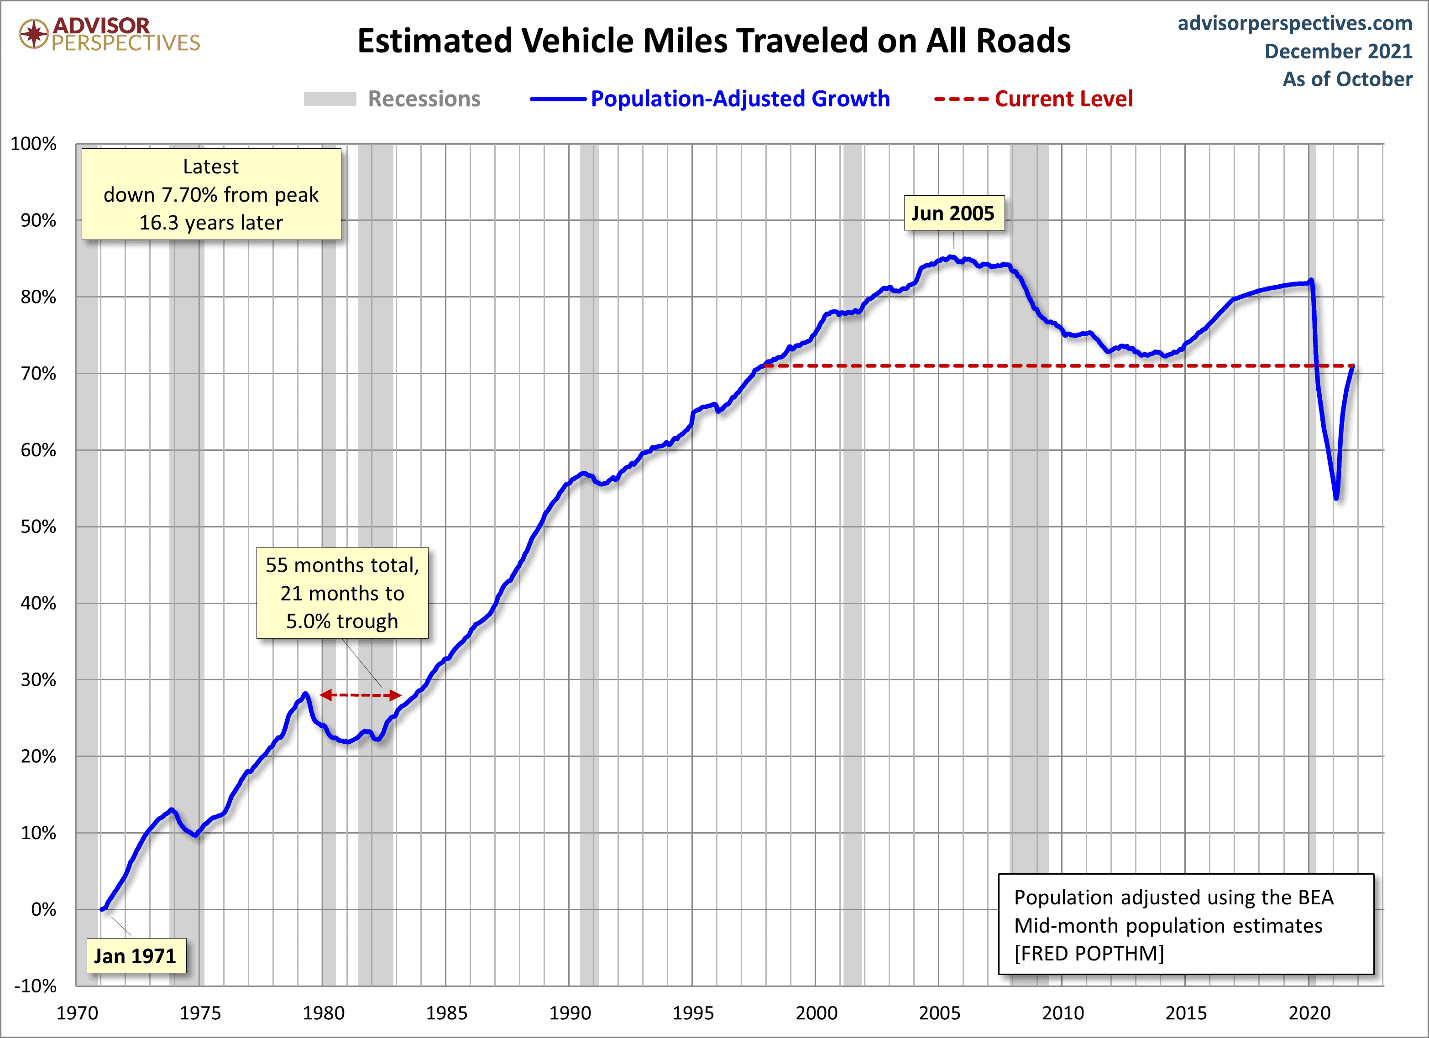
TABLE 8 | Estimated Vehicle Miles Traveled on All Roads | Advisor Perspectives
And yet, as you can see in Figure 9, gasoline price have almost doubled since the beginning of 2020.
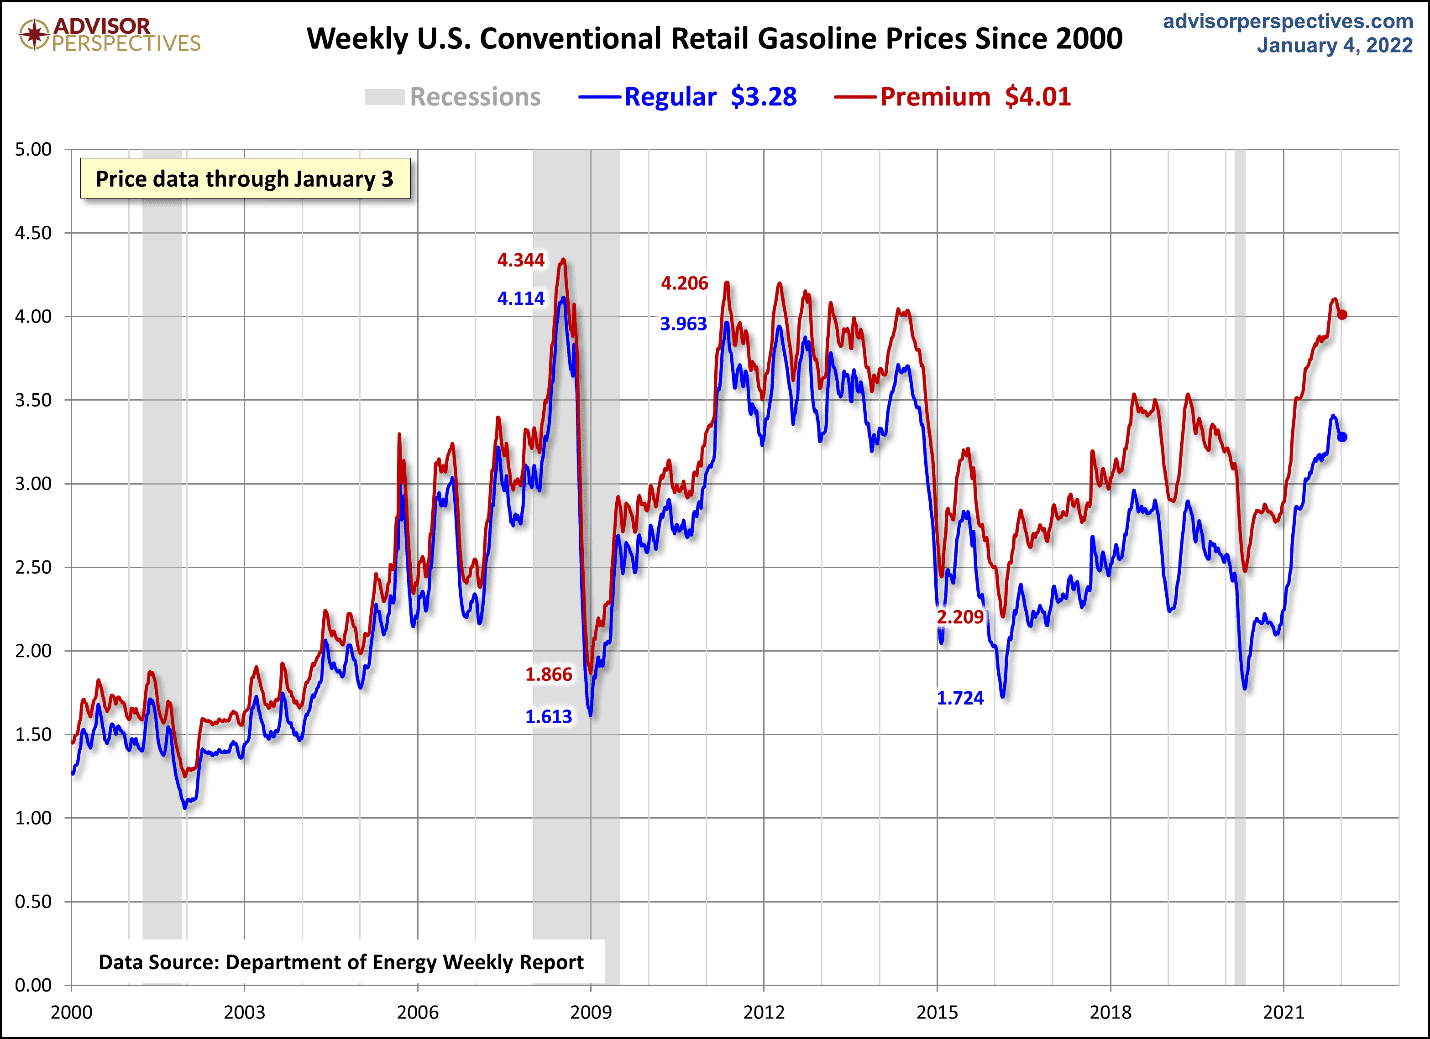
TABLE 9 | Weekly U.S. Conventional Retail Gasoline Prices Since 2000 | Advisor Perspectives
Eight Components of CPI that Measure Price Inflation for the Consumer
While were here, let’s look at the eight components of the Consumer Price Index) that measure price inflation for the consumer. Figure 10 assesses how much inflation there has been since 2000 in these areas. Note too that there are two measures of CPI. One includes food and energy. The other one excludes them as they tend to be more volatile and often unrelated to actual inflationary pressure, but instead it’s affected by external forces such as weather and regulations.
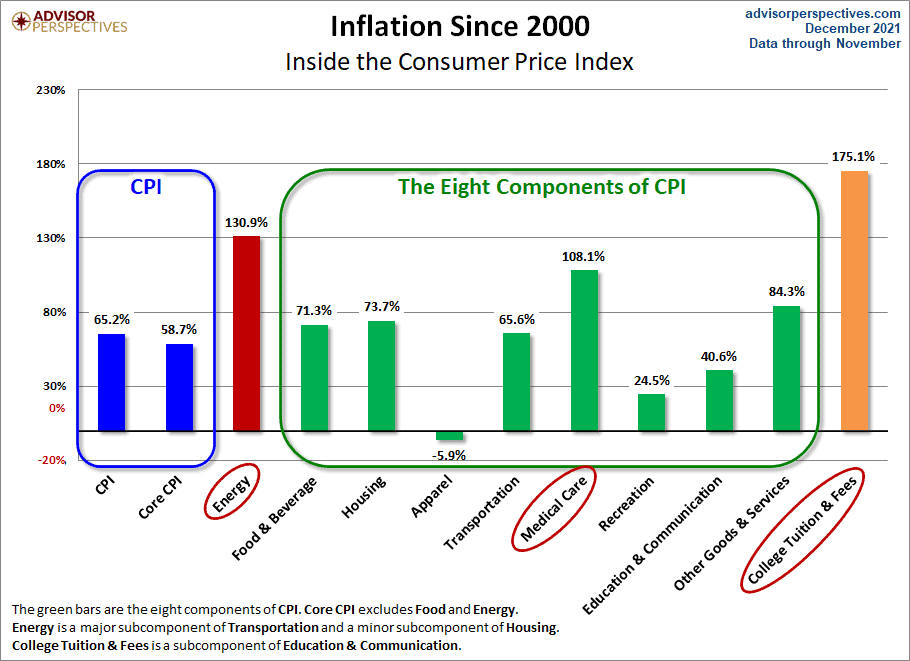
TABLE 10 | Inflation Since 2000 | Advisor Perspectives
Over the last 21 years, the core CPI has increased by 58.7%. The CPI including food an energy has increased by 65.2%. Over that time, prices have not always gone up. They can and do move sideways or down. Go back to Figure 3 (the supply and demand chart). That tells you what the reasons may have been.
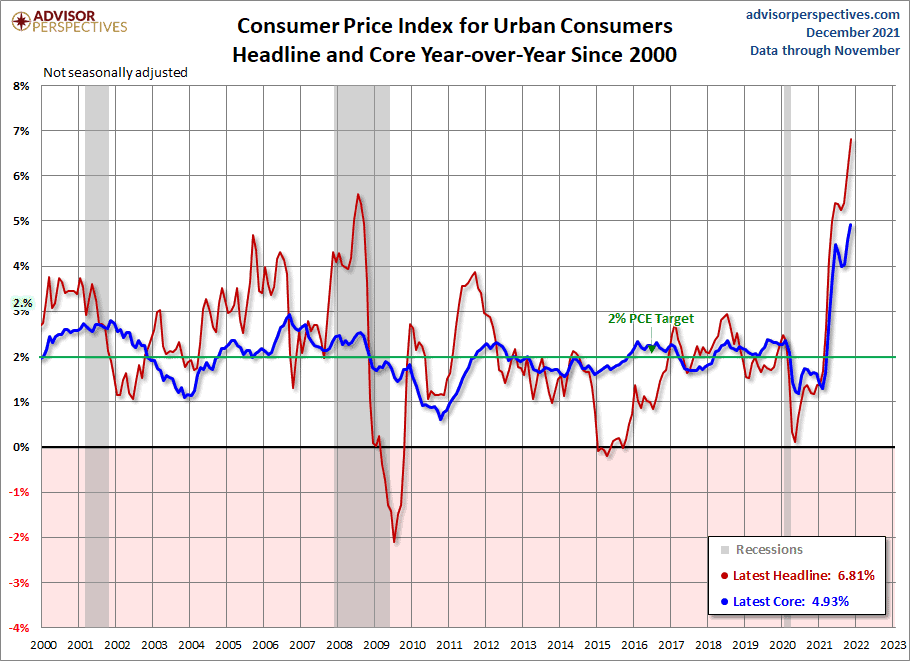
Then, consider Figure 11, which shows you the CPI in line graph form since 2000. It tells a vastly different story than Figure 10 because it lets you see that there is nothing normal about what is going on today.
Key Indicators of Inflation
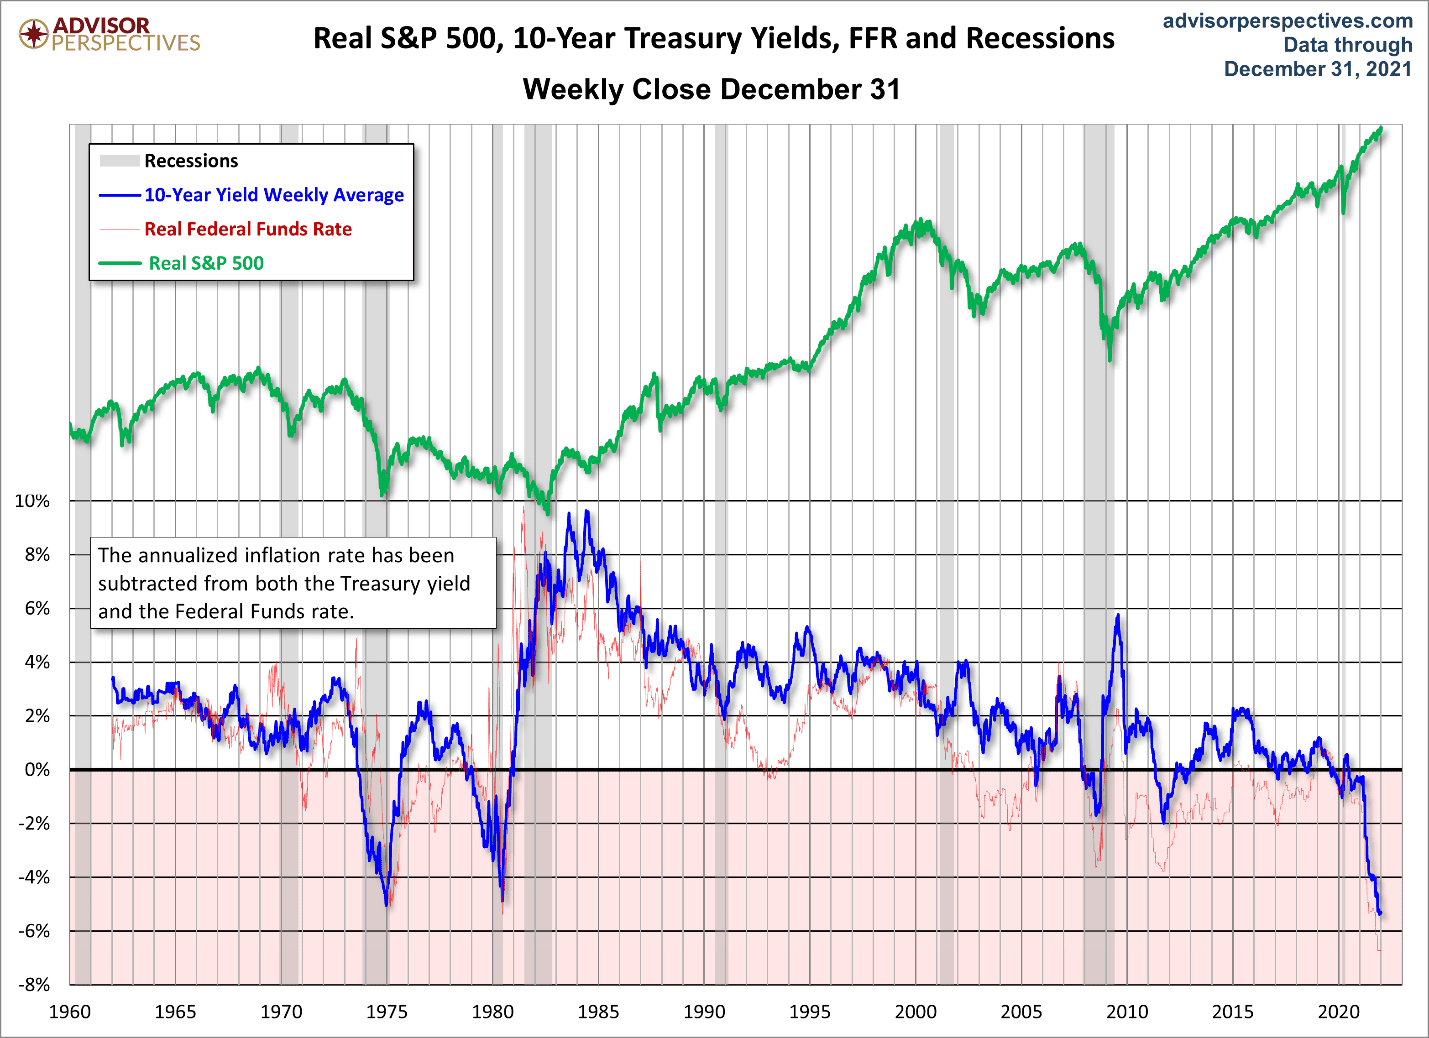
The arrival of real, long-term, sustained inflation will generally be marked by a few key indicators. Two of those are 10-year treasury bond yields, and the velocity of money. The 10-year treasury bond is historically a good proxy for the rate of inflation, as evidenced in Figure 12. Note the close relationship of the lines indicating both.
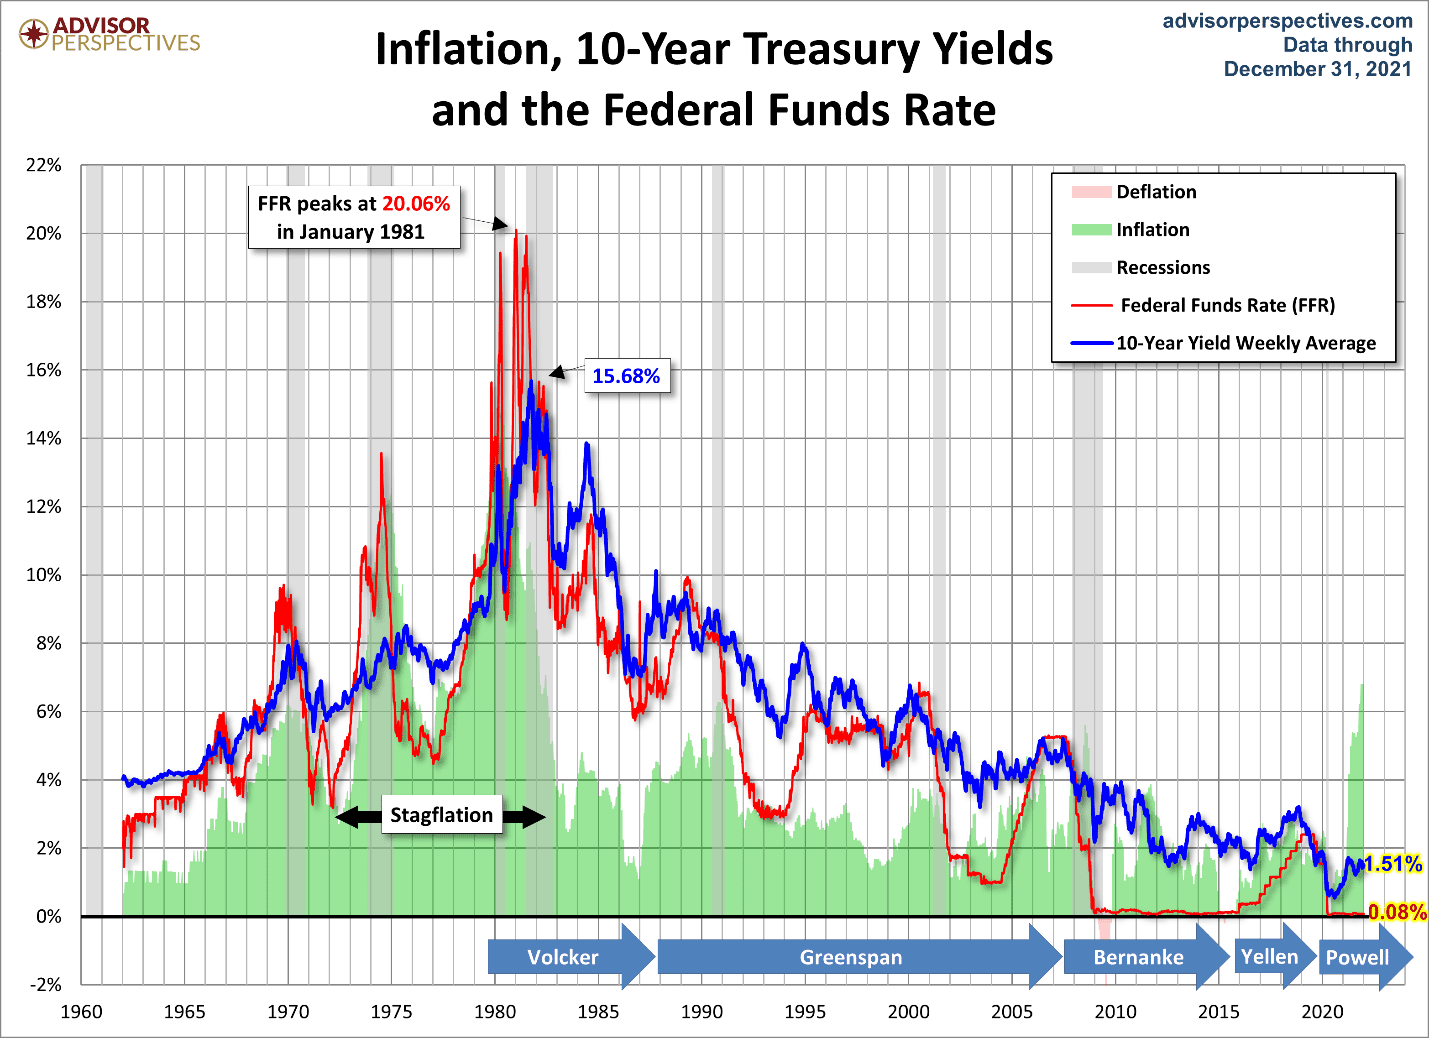
TABLE 12 | Inflation, 10-Year Treasury Yields and the Federal Funds Rate | Advisor Perspectives
10-Year Treasury Yields
In the early 1980s, the inflation rate and 10-year treasury yield were over 15%. Meanwhile, the Fed Funds Rate peaked at just over 20%. By 1984, inflation had fallen to around 4%. We’ve bounced around between 2% and 4% since then until recently as you can see in Figure 13.
Money Velocity
Note the divergence in the 10-year treasury yield and the inflation rate. Either the inflation rate is a blip on the radar or the 10-year treasury is no longer a good proxy for inflation. The other indicator I mentioned earlier is the velocity of money. Let’s see what’s happening there in Figure 14.
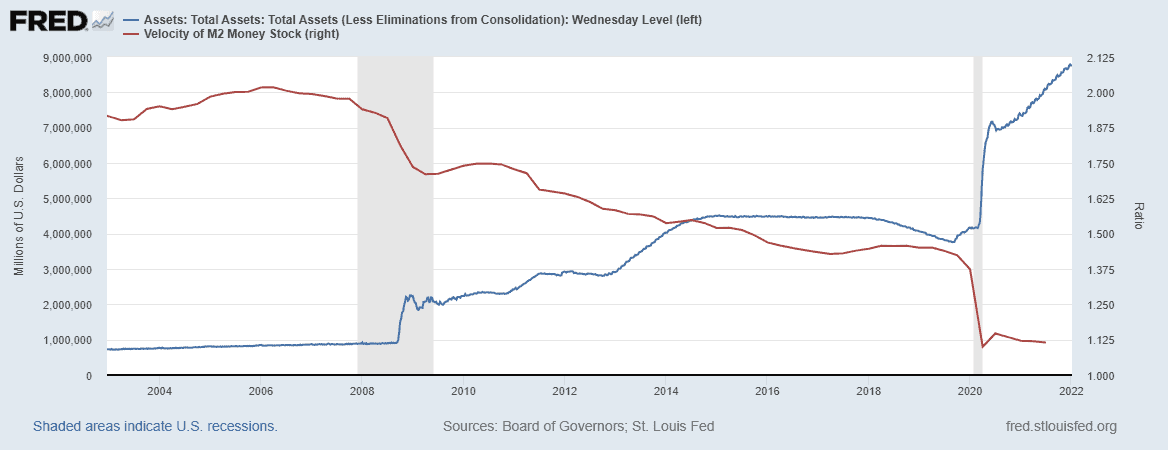
TABLE 14 | Money Velocity | FRED
The answer is not much. Even as the Federal Reserve’s balance sheet expands through its bond-buying program, injecting money into the financial system, it’s not moving through the system at a rate commensurate with inflation. In fact, money velocity is still near the lowest point we’ve ever measured it since the beginning of this data series.
The 10-year treasury yield and the velocity of money tell us that the inflationary pressures we’re seeing today aren’t likely to be long lasting. They are also likely artificial in nature.
Gold Going Against the Grain of Inflation?
Even gold, which we’re constantly told is a great hedge against inflation since it usually goes up in value in inflationary times, has failed to indicate that the inflation is real. As you can see in Figure 15, gold went up in 2020, but lost value in 2021. Weird behavior for an inflation hedge if we’re in an actual inflationary period, don’t you think?
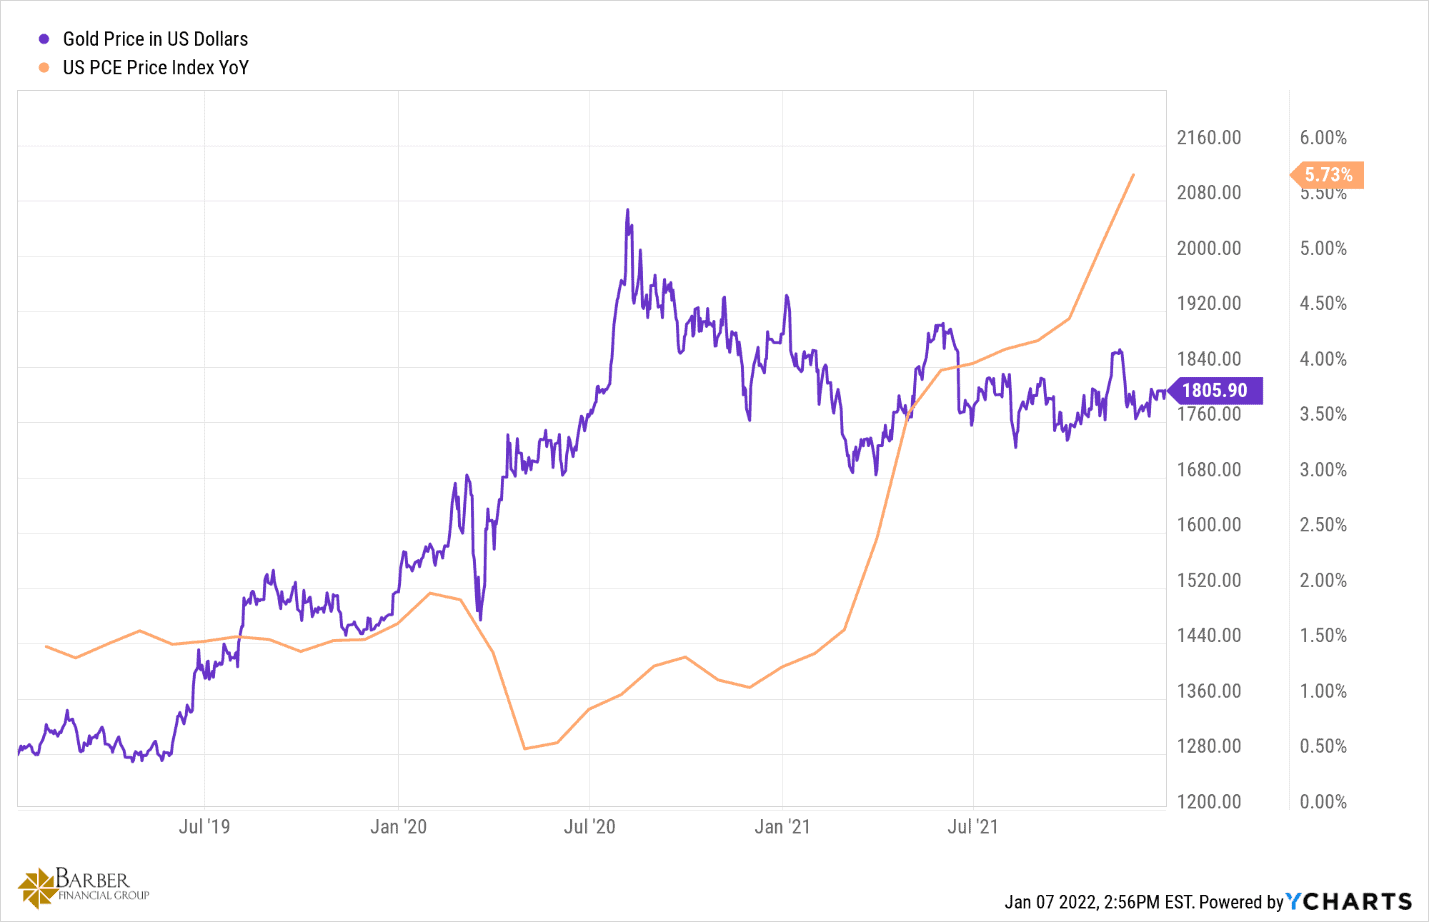
TABLE 15 | Gold Price | YCharts
Perhaps the gold guys have come to the same conclusion that I have—that this is all supply chain disruption driven. When the supply chain is repaired, things will go back to “normal” (if there is such a thing). Time will tell.
Understanding the Manufacturing Process
Let’s spend some more time now on the supply chain itself. I don’t know how many people understand how interconnected and interdependent the global economy has become and how fragile the current system can be to things like pandemics, accidents, and natural disasters. I want to use a manufacturing process that’s easy to understand to illustrate this for you.
In this case, we’re going to make pencils. This includes plain old #2 pencils, colored pencils, fancy pencils, and custom labeled pencils. There are some cool YouTube videos that show the pencil-making process. Faber-Castell has one that I thought was awesome. Here is a detailed description from the folks at Faber-Castell themselves.
14 Steps to the Process of Making Pencils
1. Pressing and Drying the Leads
The soft graphite mixture is extruded through a nozzle to form long strings. These are cut to length and dried in perforated tins. The cylindrical baskets turn during the drying process preventing the leads from sticking together.
2. Wax Bath
To enhance the writing experience, the leads are immersed in a bath of liquid wax to allow for a smooth color lay down on paper. We could listen to that bubbling sound for ages.
3. Milling the Grooves and Applying Glue
Have you ever wondered how the lead gets into the pencil? It’s not by drilling a hole into a piece of wood. Grooves are milled into two slats of wood and to make the lead break resistant, glue is applied evenly over the entire length.
4. Inserting the Leads
This is self explanatory if you ask me.
5. Closing the Slat Sandwich
With more than one half of the pencil ready, it just needs another slat on top to achieve a proper pencil sandwich.
6. The Drying Wheel
With the leads all glued into the slat and the sandwich closed, our raw pencils head for the next step in the production process: the drying wheel. A whole bunch of sandwiches are pressed together and dried for roughly an hour, making sure that the wood does not split when the pencil is ready for our next step.
7. Milling the Pencils – Getting into Shape
Classic round, hexagonal or grip friendly triangular, from regular to jumbo sizes. The milling process takes care of the desired pencil format.
8. Painting the Pencils – Colors!
Our Polychromos and Albrecht Dürer watercolor pencils are available in more than 120 different shades. And if you are looking for a specific color, it is quite helpful to see on the outside what’s inside. Definitely the most colorful part of the production.
9. Stamping the Pencils – Gold Foil
From classic black to glittering gold: As one of the companies with the oldest trademark, our products can be recognized by the fighting knights and the Faber-Castell logo.
10. Dipping the Pencils
Have you ever had a close look at the end of your pencils? When the Polychromos hit the markets 111 years ago, the pencil’s caps had not been painted. Today, caps are colored in different styles and shades. From the golden ring that adorns the Castell 9000 to the colorful tops of our Creative Studio pencils. Watch out for the little details that make a pencil special.
11. The Drying Room
Pencils over pencils over pencils. A pencil lover’s paradise is the drying room. And like a colorful flower border this department changes its color from day to day, depending on the hundreds of pencils that are waiting for to be sharpened.
12. Sharpening the Pencils
As beautiful as the sound of hearty sharpening is, unfortunately we wouldn’t get far with it. Nothing for the ear, but definitely attractive for the eye is our automated sharpening process: pencils gliding over rotating sandpaper. Sheer beauty to watch.
13. Visual Control
Absolutely stunning to see the speed at which our employees spot the tiniest fault in the produced pencils. Did you know that their keen eye works better than any machine?
14. Packaging
The final step is packaging the pencils in boxes and tins.
Breaking Down the Supply Chain Process for Pencil Making
Now that you know the steps, let’s look at the supply chain.
The first step in making our pencils is to make the leads. So, if I’m trying to make pencils, I need graphite to blend with clay to form my leads. Which brings us to the first supply chain issue. Guess how much graphite is produced in the U.S.? None!
According to Investing News, the last operational graphite mine in the U.S. closed in 1990. In turn, all graphite in the U.S. is imported. In 2020, U.S. firms consumed 35,000 metric tons of natural graphite totaling $21 million. Here’s a breakdown of the nation’s main import sources of graphite for 2020.
- China: 33%
- Mexico: 23%
- Canada: 17%
- India: 9%
- Other: 18%
Batteries, brake linings, lubricants, powdered metals, refractory applications, steelmaking, and, of course, pencil lead, have been among the primary end results of U.S. graphite consumption. Of those four countries listed above to pick from when sourcing our graphite, we’re fortunate that two of them share a border with us.
Depending on how price sensitive our market is, we may want to have relationships with a couple of them to minimize our chances for a supply disruption. It’s likely the Chinese graphite will be the least expensive, but it can also be the most difficult to get delivered to our factory, especially if it’s held up on a container ship waiting for a space to dock in port.
Suppliers Needed
We also need a wax supplier to maintain our wax bath for the leads. Then, we need our wood supplier. Pencils are typically made from cedar. It’s hard enough to hold its shape between factoring in the weight of the writing pressure and sharpening easily with a mechanical sharpener. Our wood is delivered to the plant in specific-sized slats, so the wood needs to be harvested, milled, dried, and cut to size prior to its arrival. No graphite, no pencils…no wood, no pencils.
Since we need to make a sandwich out of the slats to make our pencils, we’ll also need a glue supplier. We can’t have our pencils falling apart in our customers’ hands.
If we are going to add erasers to the ends of our pencils, we’ll need a supplier for those. We’ll also needs a supplier for the aluminum ferrules that hold the erasers on the pencil. Just like the graphite, the raw material for the rubber erasers is not grown in the U.S. It all needs to be imported. The primary source for this is Malaysia.
We’ll also need a foil supplier so that we can stamp our logo and other information into the barrel of the pencil. When they are finished, we can’t ship them to the store loose, so we’re going to need a container supplier. We’ll also need either our own trucks or a relationship with one or more trucking companies to move our pencils from the factory to stores across the country.
What Seems Like a Simple Process Can Be Troublesome
All of this just to make pencils. Basic, utilitarian, unassuming pencils. This is about as simple as a supply chain can be, yet there are so many opportunities for trouble in this process. Before JIT inventories became a thing, they were called Just In Case inventories.
Our simple pencil factory might have had three months’ worth of raw materials on hand at any given point in time just in case the ship got held up, truck broke down, lumber mill burned down, paint color got screwed up, or rubber plantation failed. Production would always be able to proceed, but with the huge up-front outlay of cash for all those months’ worth of materials. It was effective, but not efficient. Just in Time is more efficient until it becomes ineffective because of an issue in the supply chain.
Unprecedented Supply Chain Disruptions
Today, our global supply chain is experiencing unprecedented disruptions. It’s under extreme pressure. There are ships, hundreds of them, waiting at sea for a turn at the dock to unload their cargo containers and holds. Ports have thousands of empty containers stacked and waiting their turn to ride a ship back to their port of origin. Those containers are in the way of the full containers that need to come off the ships to make room for the empties. The logistical nightmare that is port operations continues to worsen of its own weight.
We’re also told that there is a “massive” shortage of truck drivers, which is making the problem at the Los Angeles and other Southern California ports so bad. The problem is that there is no real shortage. The only shortage affecting the port of LA is a shortage of common sense.
The port of LA only recently began operating for extended hours despite the backlog of ships persisting for months and continuing to grow. Rather than doing everything in their power to relieve the backlog, they persist in their more stringent clean truck initiative that limits the trucks which can enter the port.
Ships Stuck Out at Sea
In addition, they’ve pushed the waiting ships farther out to sea. Out of sight out of mind, right? According to American Shipper, they’ve done this under the umbrella of a specially designated Safety and Air Quality Area (SAQA) that extends 150 miles to the west of the ports and 50 miles to the north and south.
“This has sharply reduced the number of ships closer to shore, leading to suggestions that efforts to tackle port congestion are cutting into the offshore queue — a misconception that should be dispelled by the Marine Exchange’s new counting method.
In addition to the 96 ships waiting offshore on Friday, there were 31 container ships at terminal berths, bringing the grand total to 127, at or near an all-time high. The total number of container ships either at berths or waiting offshore continues to rise: It is up 25% from the beginning of November, 41% from the beginning of October and 79% from the beginning of September.
The 96 ships in the queue had an aggregate capacity of 732,263 twenty-foot equivalent units. In 2020, the customs value of imports to the Port of Los Angeles averaged $43,899 per TEU. Assuming ships are at or near capacity, and cargo values are in line with last year’s, this implies there is roughly $32 billion of cargo in Southern California’s offshore queue.”
It’s a Global Issue
And this is just one port in the U.S. This is a global issue. It’s a huge global issue that we can finally measure. Check out Figure 16.
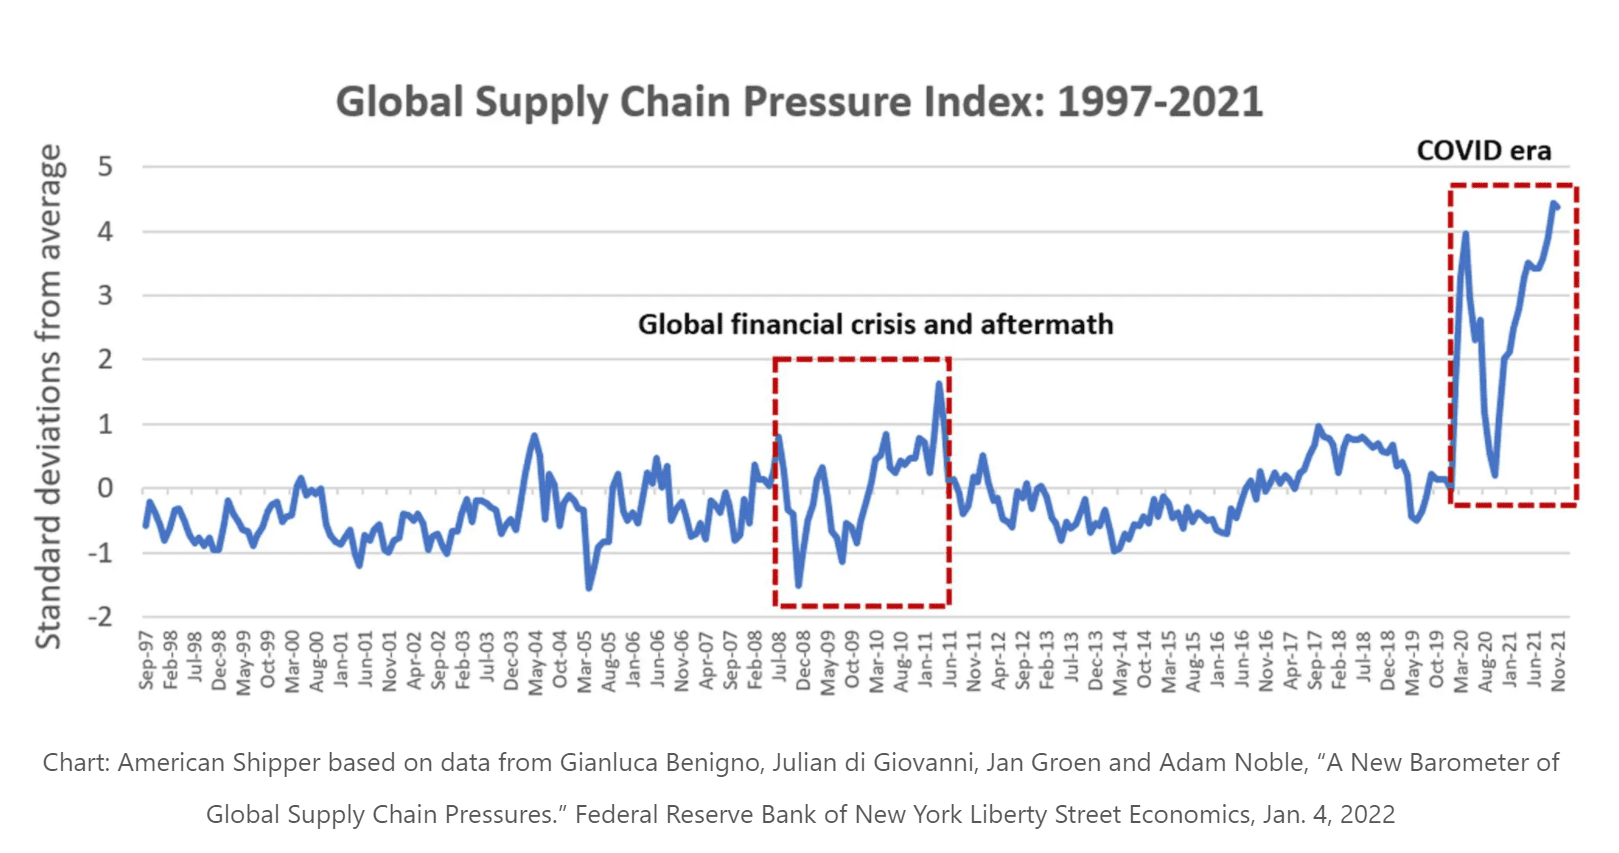
In Figure 16, the Federal Reserve Bank of New York makes it very clear that our current problems with rising prices and short supply has been created by massive disruptions in the supply chain. This new indicator is the result of the work of the four individuals noted at the bottom of Figure 16. Their research on this is well-documented if you want to learn more.
The stress on the supply chain outlined in Figure 16 is measured in standard deviations from the average going back to 1997. We are currently in excess of four standard deviations from the average, which certainly meets the definition of a black swan type of an event.
Remember that 99.7% of all observations will be found within three standard deviations from the mean. We are approaching five. That means that what is happening in our supply chain now is essentially statistically impossible. And yet, here we are.
The Truck Driver Shortage: A Huge Piece of the Supply Chain Problem Puzzle
I mentioned earlier that the truck driver shortage that is getting a lot of media coverage. I want to take a minute to address it since it is a critical piece in the supply chain puzzle.
The trucking industry has about 3.6 million employed drivers in the U.S. Of those, roughly 350,000 to 400,000 are owner/operators. The average owner operator’s truck is 2008 model year. Trucks older that 2010 are not allowed into California ports. That restriction is going to get even tougher very soon. Essentially, California has excluded 400,000 trucks from carrying the backlog of containers out of its ports. That backs up my comment earlier about a shortage of common sense at the LA ports.
As to the actual driver shortage, the industry estimated that it would need an additional 80,000 drivers. That number is the difference between the number of drivers in the industry and the optimal number of drivers based on freight demand. While 80,000 drivers seems like a lot, it’s 2% of the current number of drivers on the road.
In October, the American Truckers Association detailed the issues facing the industry and their projections for the next several years. Based on their outline, I believe they have a plan to address the shortfall in drivers so that they can carry the weight of moving all that freight from where it is to where it needs to be. The trucking industry hasn’t missed a beat throughout the pandemic, and I don’t expect that the change.
Inflation and Supply Chain Issues Go Hand in Hand
In closing, it is crystal clear to me that the inflationary pressure on prices we’re experiencing is caused by supply chain issues that continue to persist. Prices will moderate and the inflation will dissipate when the supply chain returns to normal functioning. That will not be tomorrow, nor will it be next week.
In fact, I would have expected it to have happened by now in all honesty, but resolution seems elusive. Lockdowns were responsible for the initial disruptions in the supply chain and it’s no surprise that they are partially responsible for the persistence of those issues. Countries like China continue to disrupt their production because of their response to COVID-19.
The reality is that until we come to the realization that we can’t hide from a virus in perpetuity, these problems will linger. Hiding precludes productivity and progress, both of which we desperately need.
I believe that inflation will remain with us 2022, but I’m hopeful that it will begin to moderate in the second quarter and the remainder of the year. These supply chain issues will be resolved, even if not at our preferred pace.
Schedule Complimentary Consultation
Select the office you would like to meet with. We can meet in-person, by virtual meeting, or by phone. Then it’s just two simple steps to schedule a time for your Complimentary Consultation.
Lenexa Office Lee’s Summit Office North Kansas City Office
Investment advisory services offered through Modern Wealth Management, Inc., an SEC Registered Investment Adviser.
The views expressed represent the opinion of Modern Wealth Management an SEC Registered Investment Advisor. Information provided is for illustrative purposes only and does not constitute investment, tax, or legal advice. Modern Wealth Management does not accept any liability for the use of the information discussed. Consult with a qualified financial, legal, or tax professional prior to taking any action.