Examples of Market Risk Abound in September
Key Points – Examples of Market Risk Abound in September
- The Many Examples of Market Risk That We’re Experiencing Is Creating Economic Uncertainty
- The Federal Reserve’s Continuous Battle of Raising Interest Rates to Slow Inflation
- How Is the U.S. Treasury Yield Curve Looking?
- Beware of Bear Traps!
- 7 Minutes to Read | 11 Minutes to Watch
Rising Interest Rates and Soaring Inflation Are Just a Few Examples of Market Risk
There is so much economic uncertainty, from interest rates to inflation to what’s going on geopolitically. All of those are significant examples of market risk. Dean Barber talks about those examples of market risk and much more in September’s Monthly Economic Update.
Digging into Examples of Market Risk in September
We are recording this just a few days before the end of the month, so we don’t know exactly what the month is going to end up like. Hopefully, we get a little bit of a bounce to end September, but it’s been a crazy month. The Federal Reserve obviously raised rates by another three quarters of a point. Inflation is still running hot and bond yields are up.
Home Values Cool at a Record Pace
The 30-year mortgage rate is now at 6.25%, which is no doubt another example of market risk. Home values are cooling at the fastest level in history. That doesn’t mean that the values are dropping. It just means that they’re cooling from their rapid ascent. Where do we wind up for the rest of the year? Obviously, September and October are notoriously bad months for the market.
What’s Going on with the Yield Curve?
So, the first thing we’re going to talk about are interest rates and the yield curve on the two-to 10-year treasury. Then, we’re going to jump into the rest of the markets and look at what’s happened on a year-to-date basis. And then, I’ll tell you where I think we are as far as this economic cycle and this market cycle. Let’s look at the yield curve, beginning with Figure 1 below.
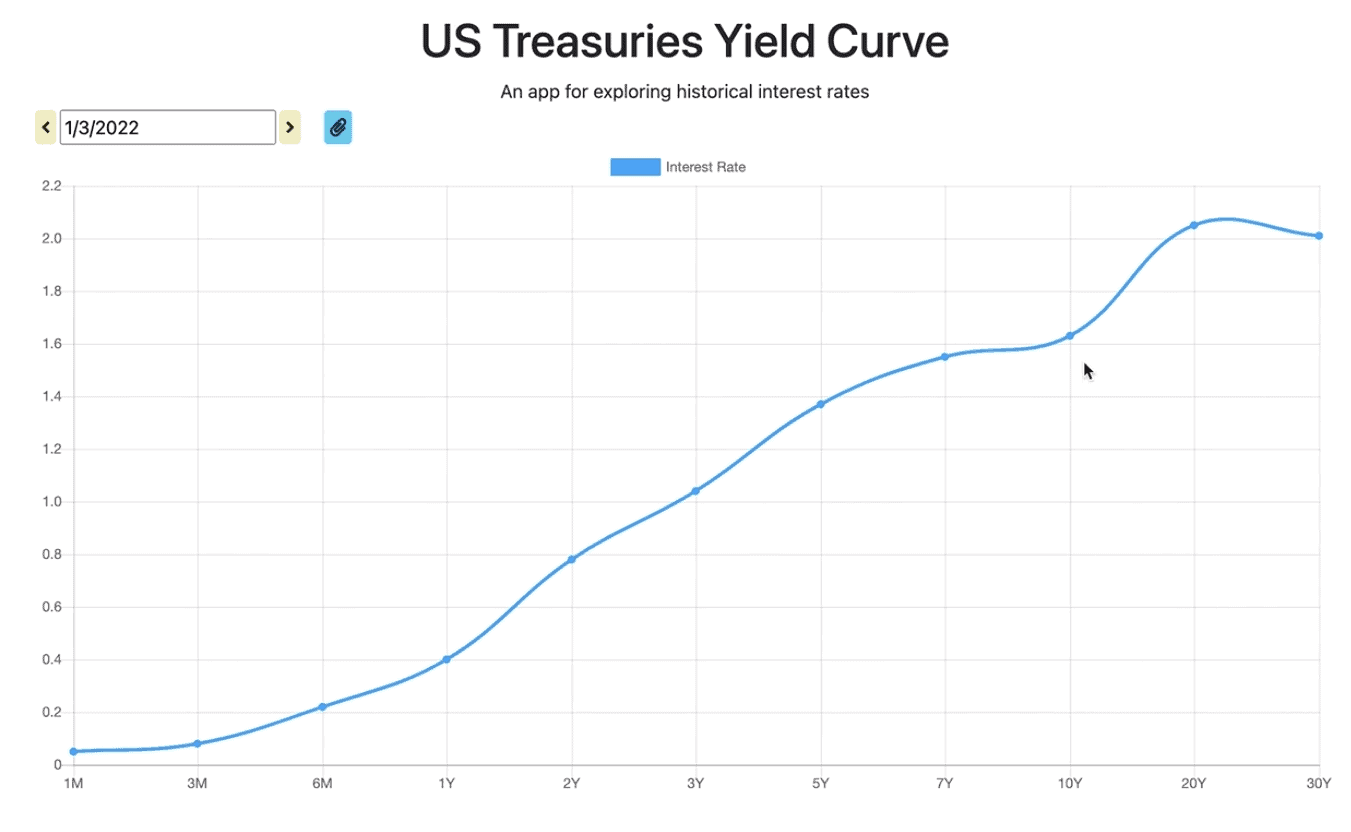
FIGURE 1 – U.S. Treasuries Yield Curve on January 3, 2022
Figure 1 shows the yield curve on January 3, which was the first trading day of the year. The two-year treasury was at 0.78% on January 3, and the 10-year treasury was at 1.63%. This is a normal yield curve. The longer you go out in duration, the higher your yield should be. Now, let’s jump to Figure 2, which shows the yield curve on September 27.
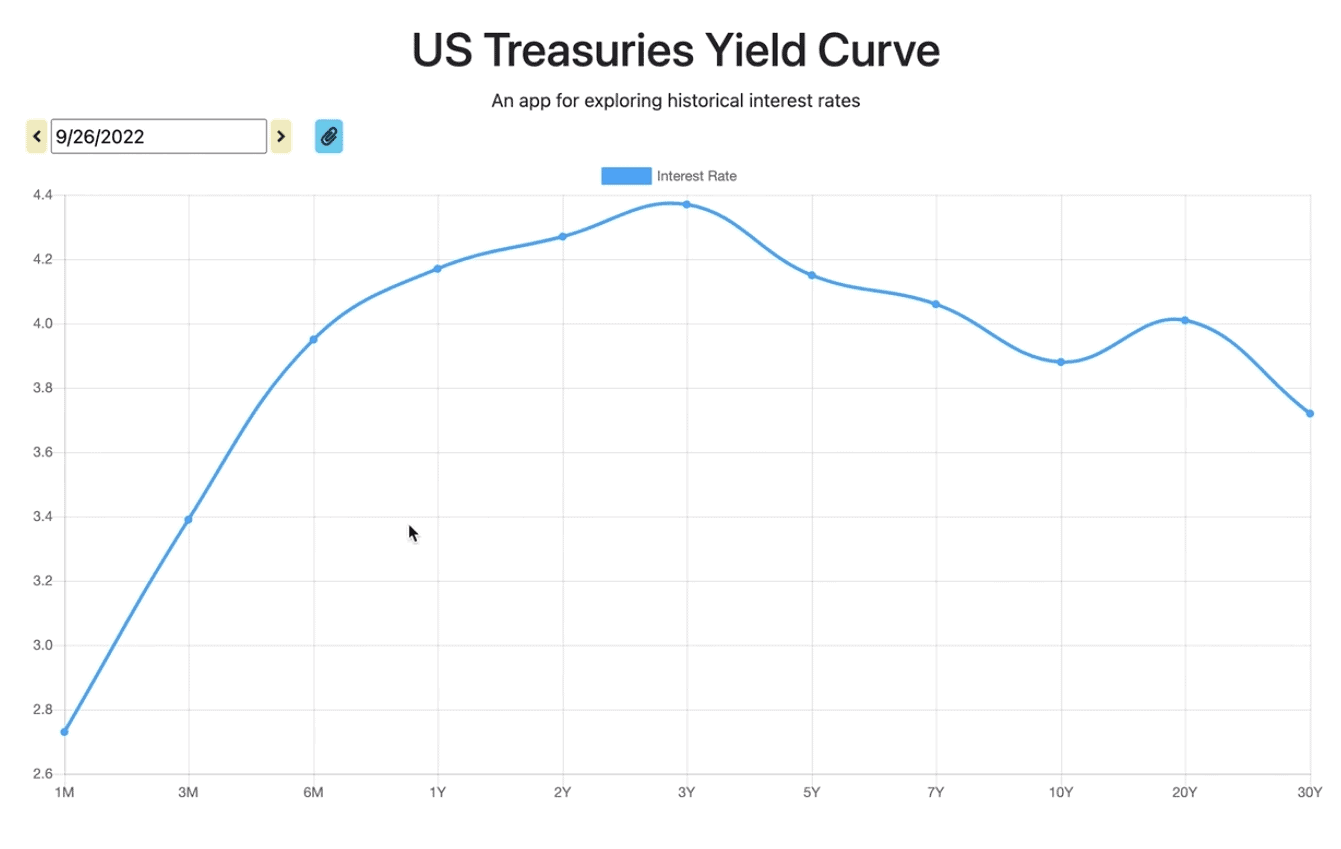
FIGURE 2 – U.S. Treasuries Yield Curve on September 27, 2022
An Inverted Yield Curve Is an Indicator of a Recession
It’s a highly inverted yield curve. The two-year treasury yield has jumped all the way to 4.27%. The 10-year treasury is also higher, but it is only at 3.8%.
From a historical perspective, any time that we have seen the two-year treasury higher than the 10-year treasury, it’s a clear sign that the economy is headed for trouble and a potential recession. The one-year treasury is above the 30-year treasury, which signals even more trouble ahead.
The big problem is that the bond market is telling us in the short-term that we’re going to have higher interest rates to stave off inflation. But in the longer-term, the bond market does not believe that the economy is going to be as robust as it is today. That’s where the signs of a recession come in.
Beware of the BEAR on America’s Wealth Management Show
The Federal Reserve is raising interest rates to combat it, but inflation still looms large over the US economy. How do you build a plan that considers such a surge in inflation and interest rates? Find out as Dean Barber and Bud Kasper discuss how to plan for inflation.
While They’re Not Enjoyable, Recessions Are Normal
I don’t want to scare anybody or be a fearmonger. I just want to let people know that recessions are normal. They come and they go. At the end of a recession, we have had a wash out and get a reset. The markets and the economy then they take off again.
I think that the American consumer today is still in good health. What’s happened, though, with inflation is hurting the discretionary spending for most American consumers. The Fed really has a tough job ahead.
The Federal Reserve wants to stop inflation and not cause a recession. As time goes on, the possibility of that seems smaller and smaller. A lot of economists are expecting that we are going to head into a recession later this year into early next year. Nobody knows the duration or depth of a recession.
We have already had two consecutive quarters of negative GDP growth. By the time we record our October Monthly Economic Update, we’ll have the third quarter stats in, so we’ll know what the GDP growth was for Q3. That will give us an even better sign of whether we are indeed in a recession.
Some Chilling Market Performances
So, how is that impacting the different financial markets? Let’s look at some of the major indexes below in Figure 3.
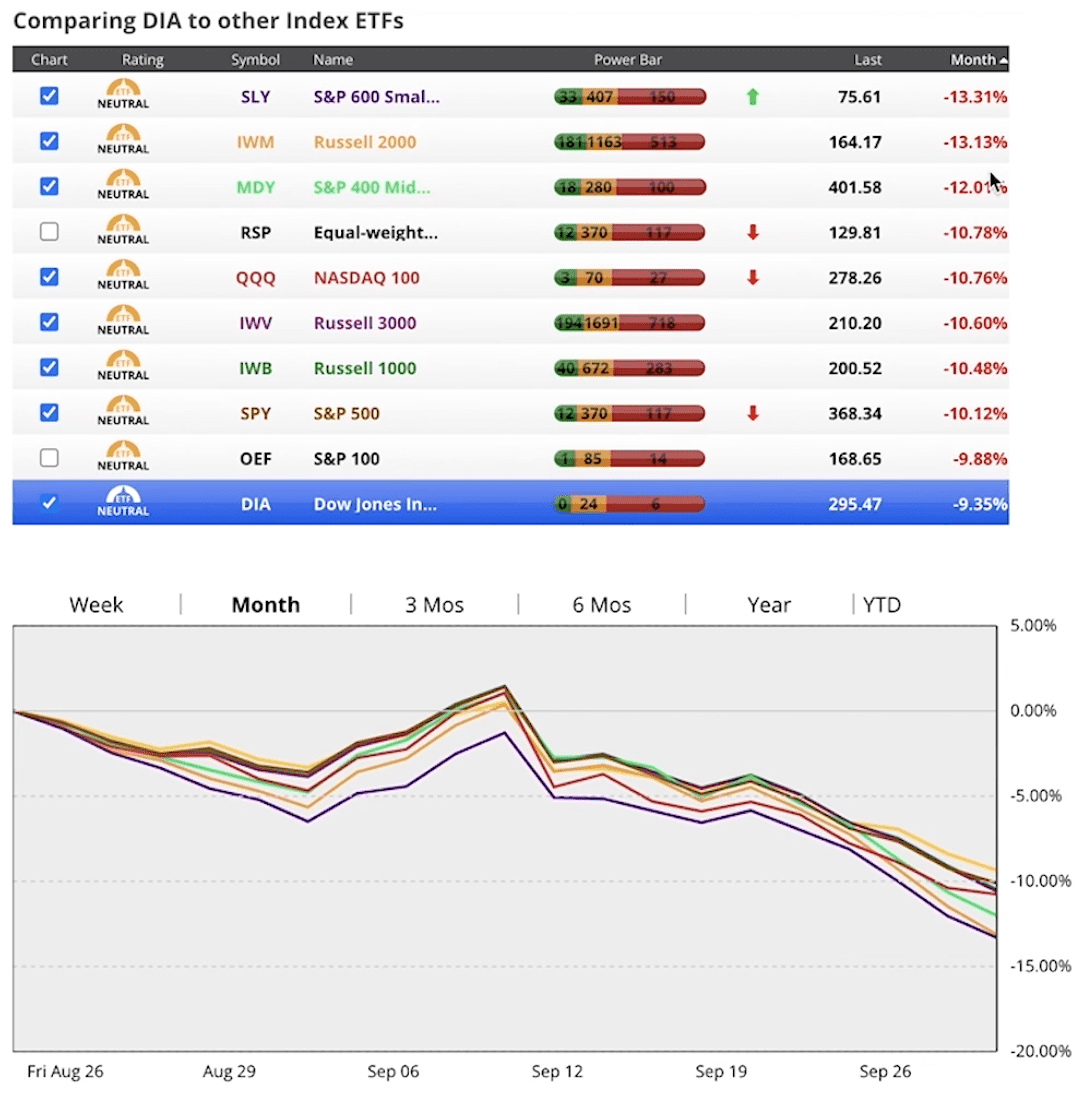
FIGURE 3 – Market Performances Over the Past Month – Chaikin Analytics
Over the past month, the S&P 600 Smallcap is down by 13.31%. The best-performing sector over the last month is the Dow Jones Industrial Average, which is down by 9.35%.
Those are some chilling numbers. But I think even more telling is that there are no stocks in the Dow Jones Industrial Average that are considered bullish right now. Six of the 30 are considered bearish and 24 are considered neutral.
Look at the number of stocks that are in bearish territory versus neutral territory versus bullish territory in all these different indices. You’ll see anywhere from 0% on the Dow to as much as 9% on the Russell 2000 that are in bullish territory. That gives every one of these major indexes a neutral weighting.
We’ve been going through that this year and have seen some go from a little bit less than neutral to a little bit more than neutral. And some have gone to bullish.
Patience Is Pivotal When Dealing with These Examples of Market Risk
Now, we’re all sitting in neutral. This is something that I look at multiple times throughout the week to kind of see where the markets are thinking that we’re headed.
At this point and with everything sitting in neutral territory, patience is key. And it’s not that we think that there’s going to be a total washout in the stock market. There are some big fund managers and big economists that are saying there could be another 15% or so drop in the overall markets before this whole thing is said and done. That’s totally possible, but it won’t necessarily happen. There are a lot of people that think that we’re close to a bottom here and that we should see some sort of a rally.
I believe that for us to start seeing some sort of a rally in the stock market, we’re going to need to see that the Fed has made significant progress in calming down inflation so that they can ease off their aggressive interest rate increases.
We Don’t Want to Relive the Great Recession, But What Can We Learn from It?
Another thing I want to do in this Monthly Economic Update is to review the Great Recession. I don’t ever want to live through it again, but I want to take you through it so you can see what happens during bear markets. Look at the dates of the cycles below in Figure 4.
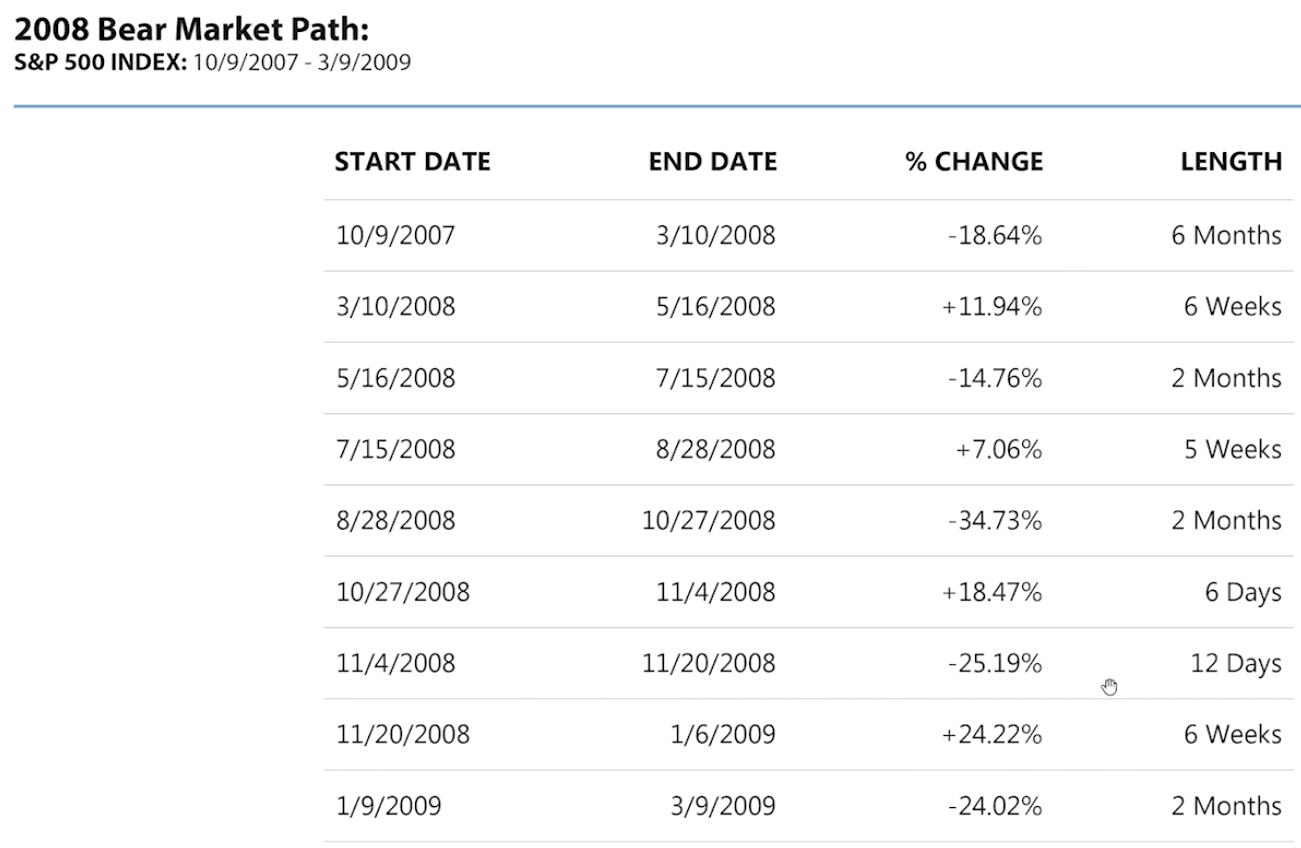
FIGURE 4 – 2008 Bear Market Path – Anchor Capital
From October 9, 2007, to March 10, 2008, the S&P 500 lost 18.64%. And then in about two months, it made 11.94%. After that in about another two months, it lost 14.76%. And then at about a month and a half, it made 7%. After that in another couple of months, it lost 34%. And then in just a few days it made 18% before losing 25% in just a few days.
After that it made 24% in a little over a month, before losing 24% in another two months. All told here, this had the S&P 500 down by over 50% through the Great Recession.
Watch Out for Those Bear Traps
During the Great Recession and in just about every bear market, there were some very violent upswings. A lot of times when those violent upswings occur, that will cause people to believe that the bear market is over. This can be what we refer to as a bear trap. We need to be conscious of what’s really going on behind the scenes to determine whether we’re in a bear market rally or if we’ve seen the end of the bear market.
Caution is the name of the game right now. We should be pulling back on risk. We’ve made adjustments to many of the portfolios to reduce risk.
A Bad Year in the Bond Market
One of the things that’s happened that has caught a lot of people by surprise is that the fixed income sector hasn’t been a good performing sector so far this year. Let’s look at Figure 5 to see the year-to-date basis at some of the major indices, including the bond aggregate.
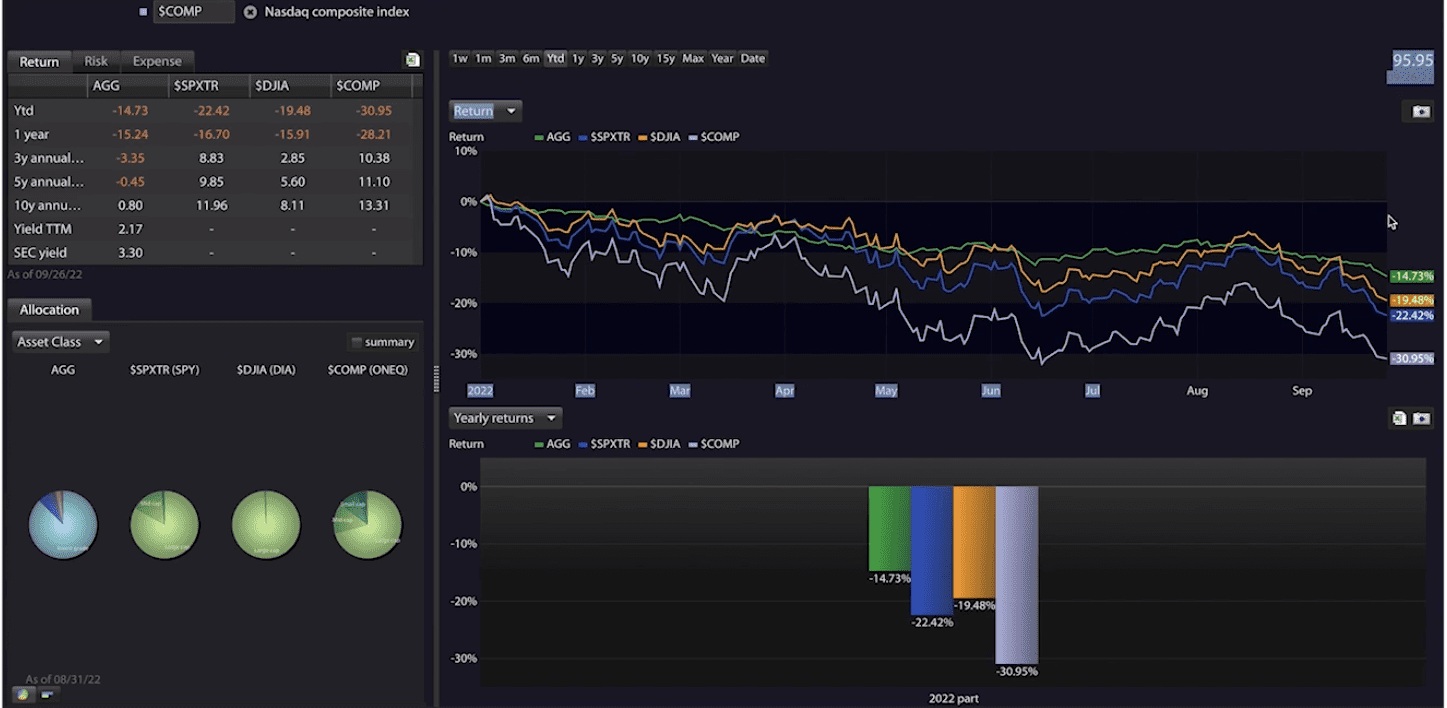
FIGURE 5 – Year-to-Date Bond Market Performances
In Figure 5, the green is the AGG, which is the iShares U.S. aggregate bond ETF. The blue is the S&P 500. The orange is the Dow Jones Industrial Average, while the NASDAQ composite is purple.
The bond aggregate is down almost 15% this year. The Dow Jones Industrial Average is the best equity index and it’s down 19.48%. Meanwhile, the S&P 500 is down 22.42% and the NASDAQ composite negative by 30.95%.
How Do We Know Once We’re Getting Out of a Bear Market?
When you start looking at the markets, it’s interesting that we keep getting lower lows. When we start to get these rallies and the lows that we get when the markets pull back again are higher than the previous lows, we can start getting a good feeling that we’re coming out of the bear market. We might have brighter skies ahead.
I want to encourage everybody to take the time to visit with your advisor and understand that these times are very difficult to navigate. If you feel that you’d like us to back off on risk a little bit more, we’re happy to do that. We always do know that when we go through times like this that it’s never comfortable, but it’s not unfamiliar for us. We want to make sure that this is as comfortable for you as it can possibly be.
These are trying times. We know that there are a lot of things domestically and globally that are putting a lot of pressure on the markets. That, in turn, is causing a lot of uneasiness.
Keep in Touch with Your Advisor When Navigating These Examples of Market Risk
As we head into the fall, we’ll continue to keep a close eye on things. Make sure that you keep in contact with your advisor. If you do want to get more conservative, we can always get more conservative. And then when we think that there’s a clear sign that things have turned around, we can get back to the same types of models that you had before to capture some of that upside potential in the future.
I appreciate you taking the time to join me for the Monthly Economic Update. I’ll talk to you next month. If you’re not a client of Modern Wealth Management and want to learn more about these examples of market risk and how they relate to your personal financial situation, we have an opportunity for you. You can access our industry-leading financial planning tool from the comfort of your own home at no cost or obligation. Just click the “Start Planning” button below to begin building your financial plan today.
As you start building your plan and seeing some of these examples of market risk, you’ll probably see why our financial planning tool is intended for professional use. Well, you also have the opportunity to schedule a 20-minute “ask anything” session or complimentary consultation with one of our CFP® professionals at no cost or obligation. We’ll be happy to set up a virtual meeting with you to walk you through the results of your plan. Thanks again for joining me, and make sure to share this video with your friends.
Schedule a Complimentary Consultation
Click below to get started. We can meet in-person, by virtual meeting, or by phone. Then it’s just two simple steps to schedule a time for your Complimentary Consultation.
Investment advisory services offered through Modern Wealth Management, LLC, an SEC Registered Investment Adviser.
The views expressed represent the opinion of Modern Wealth Management an SEC Registered Investment Adviser. Information provided is for illustrative purposes only and does not constitute investment, tax, or legal advice. Modern Wealth Management does not accept any liability for the use of the information discussed. Consult with a qualified financial, legal, or tax professional prior to taking any action.