Understanding Your Tax Allocation
Key Points – Understanding Your Tax Allocation
- Defining Your Tax Buckets: Taxable, Tax-Deferred, and Tax-Free
- Evenly Distributing Your Money Across All Three Buckets
- The Pros and Cons of Each Bucket
- Finding the Best Tax Allocation for YOU
- 8 Minutes to Read
Next Up in Our Three-Part National Financial Planning Month Series Is How to Understand Your Tax Allocation
Last week, Drew Jones led off a three-part series to celebrate National Financial Planning Month with his article, Retirement Analysis: Current vs. Proposed Plan. If you read Drew’s article, you’ll remember that he said that we’ll be diving much more into tax allocation in this series, and that’s exactly what I’ll be doing.
The Three Tax Buckets
I have a few examples I’ll be going over to help you understand tax allocation. But first, it’s critical to define the three tax allocation buckets. They are taxable, tax-deferred, and tax-free.

FIGURE 1 – Tax Buckets
Taxable
Your taxable bucket has money that has already been taxed. Examples of this include brokerage and savings accounts and taxable money.
Tax-Deferred
In your tax-deferred bucket, you have your 401(k)s and 403(b)s, pensions, and IRAs. It’s money that hasn’t been taxed yet, but is taxable once you access it. In many instances, you get a tax deduction for putting the money in the tax-deferred bucket. While there are some limits, this money grows without being taxed.
Tax-Free
And then there’s the tax-free bucket. It usually involves Roth accounts. As opposed to getting the benefit on the front end with your tax-deferred money, you’re getting the benefit on the back end here because it’s tax-free once you access the money. You are just required to pay your taxes on the front end.
The goal is to evenly distribute your money across all three buckets to create flexibility when you’re doing tax planning. We call this tax diversification. Keep each of these buckets in mind, as I’ll be coming back to them later in the article.
Going Back to the Sample Plan of Sam and Samantha Sample
Before I get into some of my tax allocation examples of the impact that tax diversification can make, I want to remind you of how a couple of simple tax planning strategies that Drew went over in his sample plan for Sam and Samantha Sample. By delaying Social Security until 70 rather than taking it at 65 like they had planned, they accumulated $3,002,988 in lifetime benefits rather than $2,418,633. Nearly $585,000 more sure sounds nice, doesn’t it!
Drew also maxed them out in the 22% tax bracket for a while rather than keeping them in the 12% bracket like they had planned. The most important thing to remember when tax planning is to focus on tax savings over your lifetime, not just in one year. And it’s that much more important to have the mindset now since the Tax Cuts and Jobs Act will be sunsetting after 2025. That means that tax rates be higher (back to the 2017 rates) in 2026 than they are now.
Once Drew got that message across to the Samples that they were better off paying more in taxes now than delaying them, they saved nearly $260,000 more over their lifetimes.
So, just from two changes to the Sample’s plan, they saved nearly $845,000. Drew did an excellent job in setting the stage for me to discuss tax allocation even more in depth, so take it a few more steps further.
Taxes Over the Course of Retirement from a Federal Level
The examples I’m going to use are for a 65-year-old retired couple that has already claimed Social Security and is spending $6,000 net per month. This is a typical scenario for people that our CFP® Professionals are meeting with for the first time. This couple has $1.2 million in savings. I’m going to highlight the pros and cons for this couple if they were to have all their savings in one of the three buckets—tax-deferred, taxable, or tax-free. For these examples, we’re just going to look at taxes over the course of their retirement from a federal level. Let’s start with tax-deferred.
Tax-Deferred
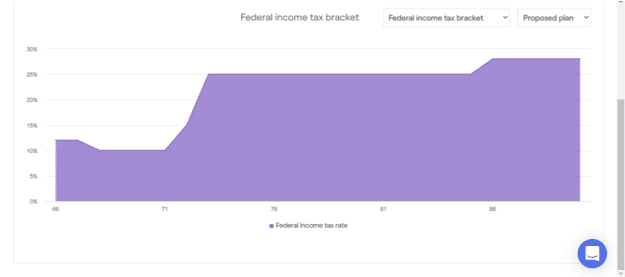
FIGURE 2 – Tax-Deferred
A couple that has only saved into their 401(k) is quite common. The couple doesn’t have any tax allocation in this situation since they’re paying tax every time they take a withdrawal. In this example, let’s say that they’re living off $5,000 a month net from their investments. So, they need to take out $6,250 gross every month (hypothetically 15% federal and 5% state) to take out $5,000 net.
That is an extra $1,250 every month coming out of their investment account. Over a 30-year retirement, that is $450,000 in portfolio erosion!
Planning for RMDs
However, you can see in Figure 2 that they have a large tax increase at 72. In this example, their Social Security and small IRA withdrawals cover their needs from 67-72. But when Required Minimum Distributions start on April 1 of the year following them turning 72, they have more income than they need. That increases their taxes and potentially the taxation of their Social Security.
While it would be ideal if both spouses had a clean bill of health and lived well into their 90s or even to 100, the odds of that for any couple aren’t likely. In this example, one spouse passes away in their mid 80s. Unfortunately for the surviving spouse, their RMD doesn’t get any smaller. They also become a single tax filer and their tax bracket gets cut in half. That is why you see an increase in taxes late in their life.
When all is said and done, the surviving spouse has a poor tax allocation and very limited opportunity for tax planning since they’ve only saved into the tax-deferred bucket. If they don’t get to spend their last dollar on their last day, their loved ones will have to pay tax on those dollars and most likely need to take it out over a 10-year period.
Taxable
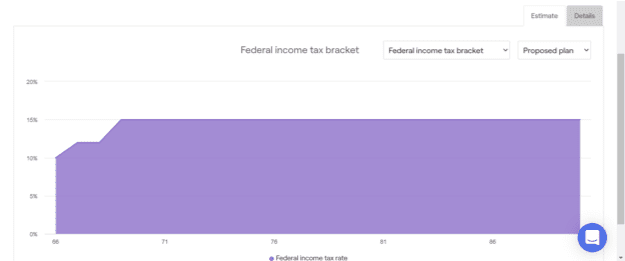
FIGURE 3 – Taxable
Now, we shift gears to what it looks like if this couple has all their $1.2 million in the taxable bucket. This is much rarer of a tax allocation that we tend to see from couples that reach out to us. Like I said, most couples will tend to fall under the realm of my first example and saving mostly into their 401(k).
This is a scenario that tends to involve business owners that have sold their business. It also can pertain to people who have sold their home, rental, farm, etc., and have a large amount of money in a brokerage account.
Looking at the Capital Gains Rate
In Figure 3, you can see this their tax bill is inconsistent throughout their retirement. They are living off Social Security and brokerage account/cash. Their tax liability is only the tax on their Social Security, but the 15% tax rate for capital gains.
On the topic of the capital gains rate, I also want to mention a great planning opportunity right now for some married couples in 2022. Married couples with taxable income below $83,350 have a 0% capital gains rate. It’s possible this couple pays little to no tax if their income is below $83,350, as they stay in the 0% capital gains rate depending on their spending.
Also, under current law, the money passes to the heirs and they receive a step up in basis.
Tax-Free
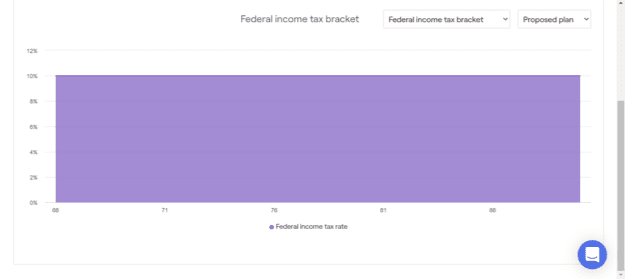
FIGURE 4 – Tax-Free
And now we get to our third bucket—tax-free. Having $1.2 million in the tax-free bucket like the couple has in Figure 4 is what I like to call, “the unicorn allocation.” All their dollars have been taxed. The only tax these people pay in retirement is a small amount potentially on their Social Security income.
The passing of a spouse doesn’t impact their tax bracket, as there is no tax obligation. And the money that passes down to their heirs is tax-free. So, while there can be some pain with paying all the taxes upfront, it can be beneficial in the long run, especially if the couple is passionate about leaving money behind to their loved ones.
Understanding How Tax Diversification Can Make a Huge Difference in Your Tax Allocation
Now that I’ve highlighted some of the pros and cons of each bucket, I’m going to add the element of tax diversification. We’re going to try to take as many of the pros from all the buckets and eliminate the cons. In the following example, the couple has $800,000 in IRAs (tax-deferred), $200,000 in a taxable account, and $200,000 in a tax-free account. Let’s see what that looks like for them over their retirement in Figure 5.
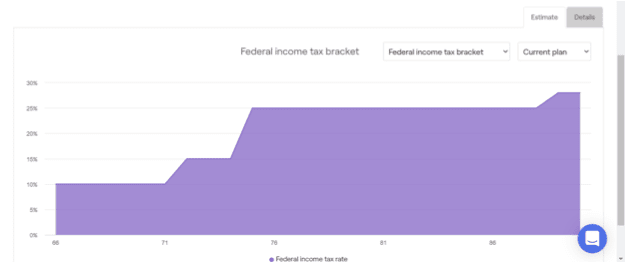
FIGURE 5 – Tax Diversification
This couple is in a low tax environment for the first part of retirement. They can live off the taxable account to supplement income that Social Security isn’t providing.
Tax rates do jump up for them due to RMDs on April 1 of the year after they turn 72. They jump again at 75 as the RMD gets large enough.
Taking Advantage of Roth Conversions
But there is some very good news! The couple has a lot of flexibility with planning. Roth conversions are something they’ll want to consider when they’re in the 66-72 age range so they can try to take advantage of being in the 10%, 12%, and 15% brackets.
Finding the Best Tax Allocation for YOU
That being said, I do want to make another important note here. As a CFP® Professionals who works with tax professionals, I’ve gained a better understand of which account your money is going to come from and why. The example from Figure 5 is assuming that the couple will use a spend down strategy. They’ll spend from the taxable bucket first, tax-deferred second, and tax-free last. While that may work for this sample couple and others, it’s important to understand your specific situation.
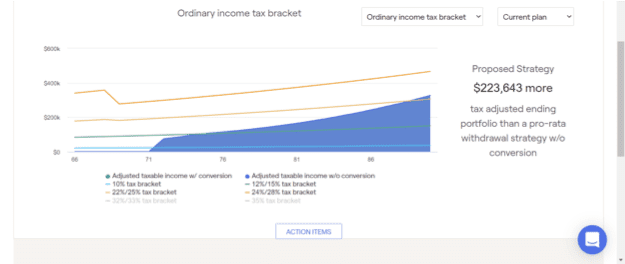
FIGURE 6 – Tax Savings Over Retirement without Roth Conversions
While still using the tax allocation example from Figure 5, I want to illustrate the tax savings for this couple over their retirement. Having a proper withdraw strategy created nearly $224,000 for them over their retirement with the proper sequence of spending. And this is without doing any Roth conversions. Creating that extra $223,643 wouldn’t have been possible if they didn’t have tax allocation flexibility.
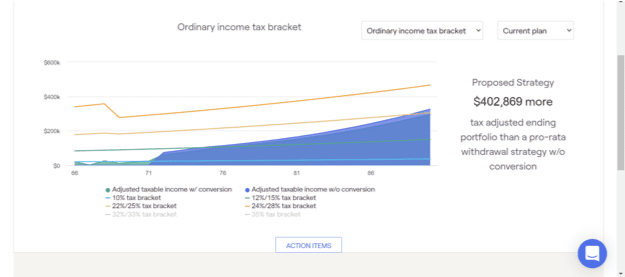
FIGURE 7 – Tax Savings Over Retirement with Roth Conversions
Now, let’s add Roth conversions into the equation with using the same tax allocation from Figure 5. Figure 7 shows that taking advantage of the low tax brackets prior to RMD age and doing Roth conversions creates more than $400,000 for this couple over their retirement than they would’ve had without any planning.
Closing Points About Understanding Your Tax Allocation
Hopefully these examples have not only helped you better understand your tax allocation, but why tax planning is so important. While tax planning strategies in retirement can make a big impact in retirement, you shouldn’t wait until you retire to start thinking about them. Your tax allocation will be decided by how you save during your working years. If you haven’t done so already, I encourage you to watch our Modern Wealth Management Educational Series webinar, What Is Tax Diversification?, with Dean Barber and Corey Hulstein that explains how to think about your tax allocation leading up to your retirement.
Furthermore, make sure to download our Tax Reductions Strategies Guide below. It highlights many ways of how you can pay as little tax as possible over your lifetime.

Download: Tax Reduction Strategies Guide
Reach Out to Us with Any Questions About Your Tax Allocation
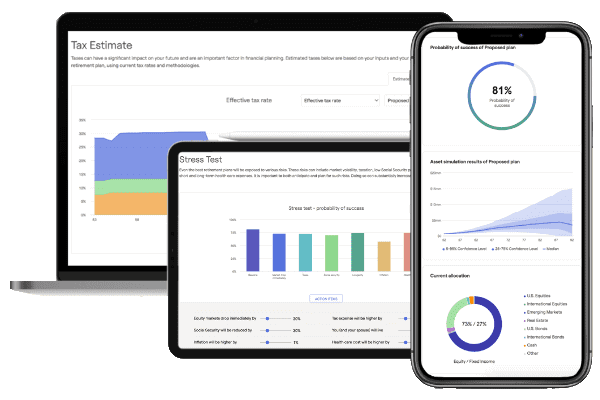
Along with watching that webinar, you can learn more about your current and future tax allocation by using our financial planning tool. It’s the same tool that our CFP® Professionals use with our clients, and you can use it from the comfort of your own home at no cost or obligation. Just click the “Start Planning” button below to start reviewing your tax allocation and see how it shapes your comprehensive financial plan.
If there’s something that you want more clarification on regarding your tax allocation, we’re happy to answer your questions. You can schedule a 20-minute “ask anything” session or complimentary consultation with one of our CFP® Professionals by clicking here. We can even screen share with you while using our financial planning tool. We don’t want you to be second-guessing yourself, so it’s our goal to provide clarity about your tax allocation and much more to help you get to and through retirement.
Stay Tuned for the Last Part of Our Three-Part National Financial Planning Month Series
Believe it or not, but we’re already halfway through National Financial Planning Month. Drew and I hope that you have taken away a few things from our articles in this three-part series. Will Doty is looking forward to rounding out this series with an article about how to read your balance sheet/income statement. So, stay tuned for more financial planning education from Will as we continue to celebrate National Financial Planning Month (even though we celebrate it every month and not just October).
Schedule a Complimentary Consultation
Click below to get started. We can meet in-person, by virtual meeting, or by phone. Then it’s just two simple steps to schedule a time for your Complimentary Consultation.
Investment advisory services offered through Modern Wealth Management, LLC, an SEC Registered Investment Adviser.
The views expressed represent the opinion of Modern Wealth Management an SEC Registered Investment Adviser. Information provided is for illustrative purposes only and does not constitute investment, tax, or legal advice. Modern Wealth Management does not accept any liability for the use of the information discussed. Consult with a qualified financial, legal, or tax professional prior to taking any action.