The S&P 500 Cap-Weighted vs. Equal0Weighted Index
Key Points – The S&P 500 Cap-Weighted vs. Equal-Weighted Index
- S&P 500 and NASDAQ in Correction Territory
- The S&P 500 Equal-Weighted Index Is in Negative Territory Year-to-Date
- A Big Jump in the 10-Year Treasury
- Bond Aggregate in Negative Territory for the Third Straight Year
- 3 Minutes to Read | 6 Minutes to Watch
The data in today’s article is as of November 1, 2023.
October Was a Wild Month in the Markets
The S&P 500 and the NASDAQ are in correction territory, meaning that there’s been a 10% drop from previous highs. The S&P equal-weighted index is in negative territory year-to-date. And the yield curve is still inverted. We’re going to tackle all that and more in our October Monthly Economic Update.
Market Performances
Below in Figure 1, you can see that over the last week, month, and three months that every major index was in negative territory.
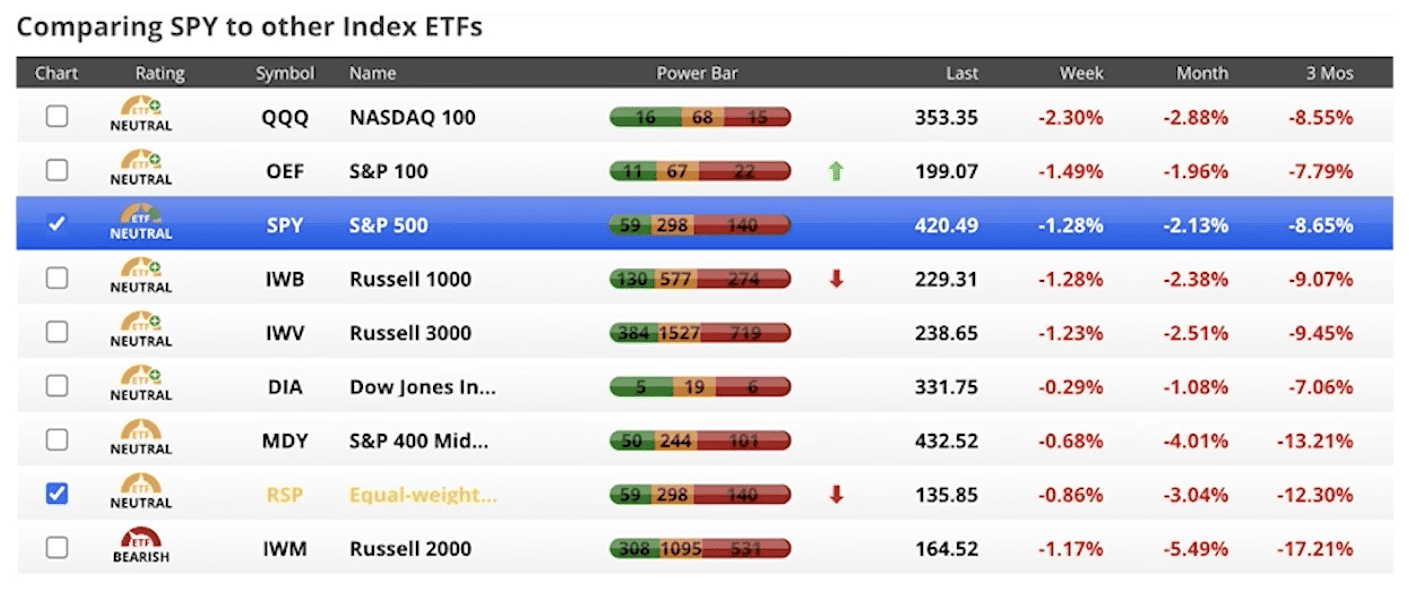
FIGURE 1 – Market Performances – Chaikin Analytics
The S&P 500 is -8.65% over the last three months. Meanwhile, the Russell 2000 was the worst performing index over the last three months at -17.21%. All the major index rating gauges are in neutral territory or neutral plus with exception of the Russell 2000, which is in bearish territory.
Let’s take a deeper look into the top holdings of the S&P 500. This is the cap-weighted S&P 500 index. Then, we’re going to compare that to the RSP, which is the equal-weighted S&P 500 index. You can see in Figure 2 that the top stocks in the S&P 500 are Apple, Microsoft, Amazon, Nvidia, Google, Tesla, and Meta. They make up more than 25% of the S&P 500.
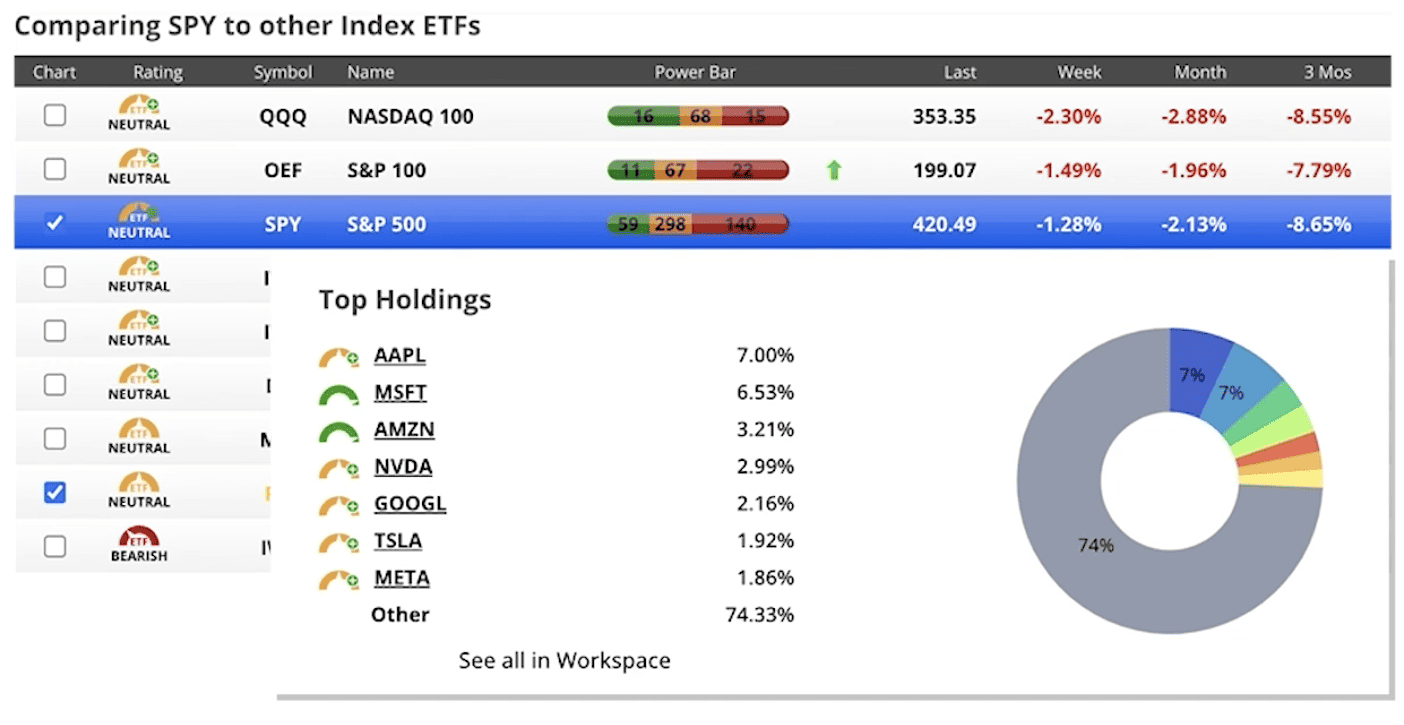
FIGURE 2 – S&P 500 Top Holdings – Chaikin Analytics
Comparing the Cap-Weighted Index to the Equal-Weighted Index
When looking at the performance of the cap-weighted S&P 500 vs. the equal-weighted S&P 500 index, look again at those seven stocks. In the equal-weighted index, you’re putting equal amounts in every stock that’s in the S&P 500.
The S&P 500 equal-weighted index year-to-date is -3.75%, while the cap-weighted index is 9.82%. This is the widest divergence that we have seen from the equal-weighted index to the cap-weighted since the Dot-Com Bubble.
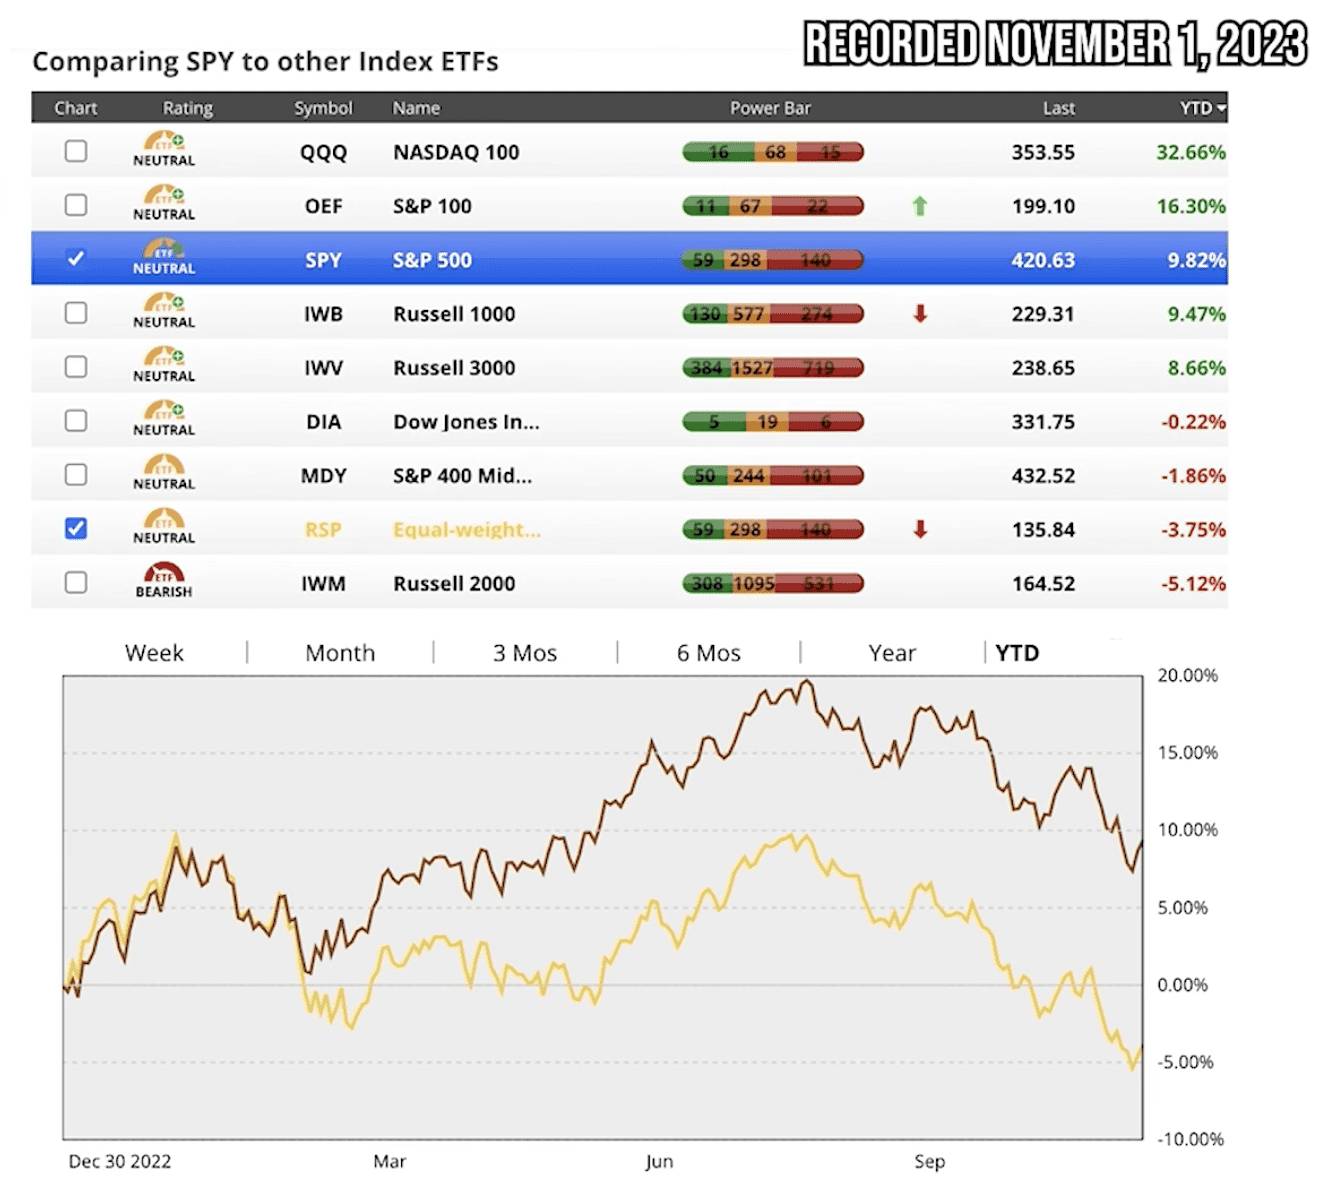
FIGURE 3 – S&P 500 Cap-Weighted vs. Equal-Weight Index – Chaikin Analytics
If you go back over the last 25 years, you wind up in almost exactly the same spot with the equal-weighted index as you do with the cap-weighted index. The very narrow focus of seven stocks has provided most of the return. In fact, if you take those seven out and do cap-weighting across the rest, it’s down about 5% year-to-date as opposed to the equal-weighted index being -3.75%. That should be a bit alarming.
Are Promising Returns on the Horizon?
However, there is some positive news as well. Since 1974, every time there has been a correction of 10% or more, the average return in the month following is 8% and the average return over the following 24 months is 24%. We have no idea if that will be the case because that’s unpredictable. There are a lot of things at play today that are still concerning.
What’s the Latest on the U.S. Treasury Yield Curve?
If we look at the U.S. treasury yield curve, the highest-paying treasury is the four-month treasury at 5.6%. The 10-year treasury has jumped all the way up to 4.8%.
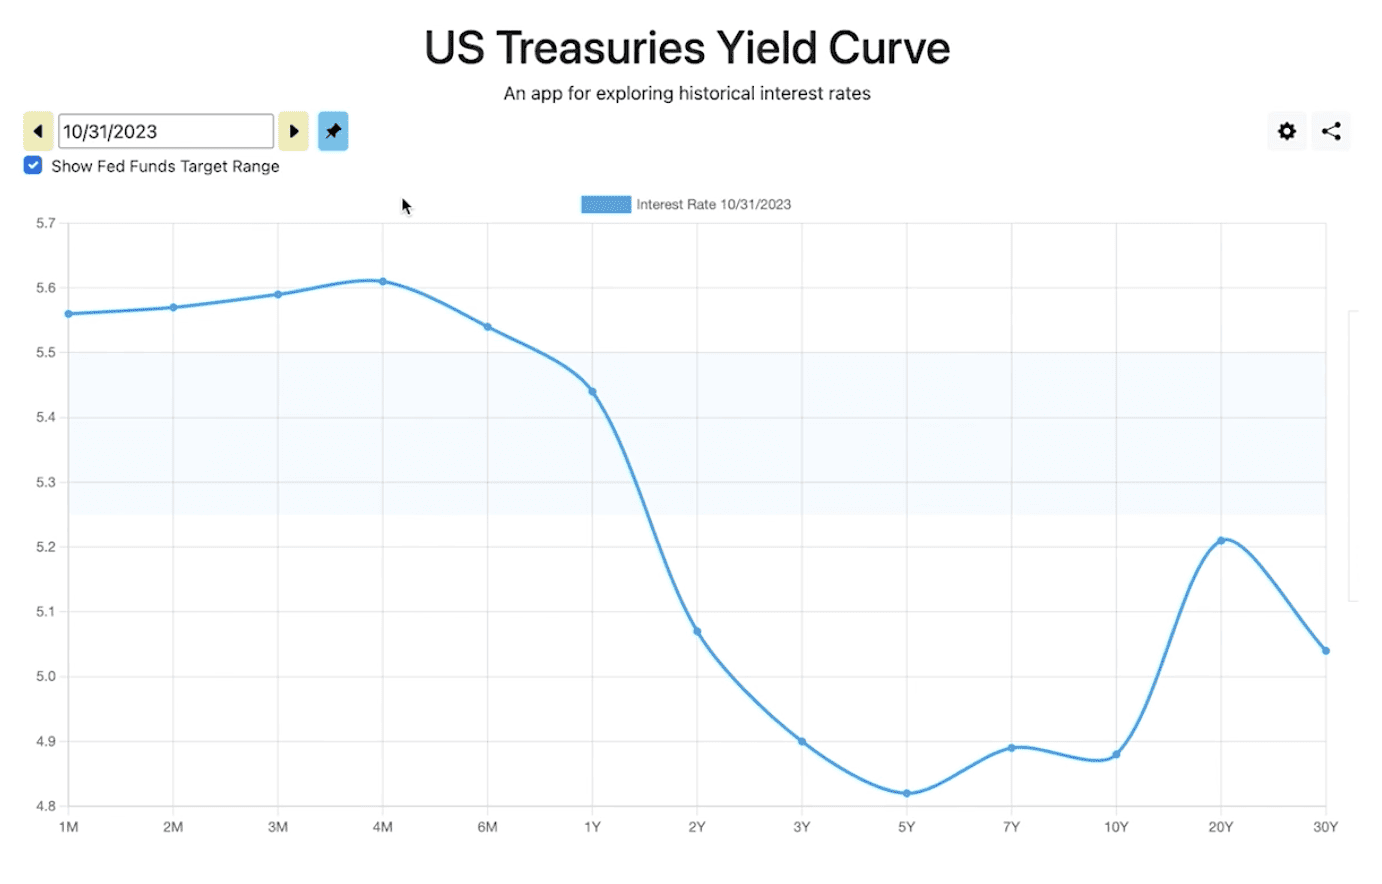
FIGURE 4 – U.S. Treasury Yield Curve
Now, if we go back to the end of June, you’ll see that the yield curve was still inverted, but the 10-year treasury then was at about 3.8%. So, the 10-year treasury yield has gone up one full percentage point since the end of June. That is putting a lot of pressure on stocks and bonds. The bond aggregate is in negative territory for the third straight year. That has never happened.
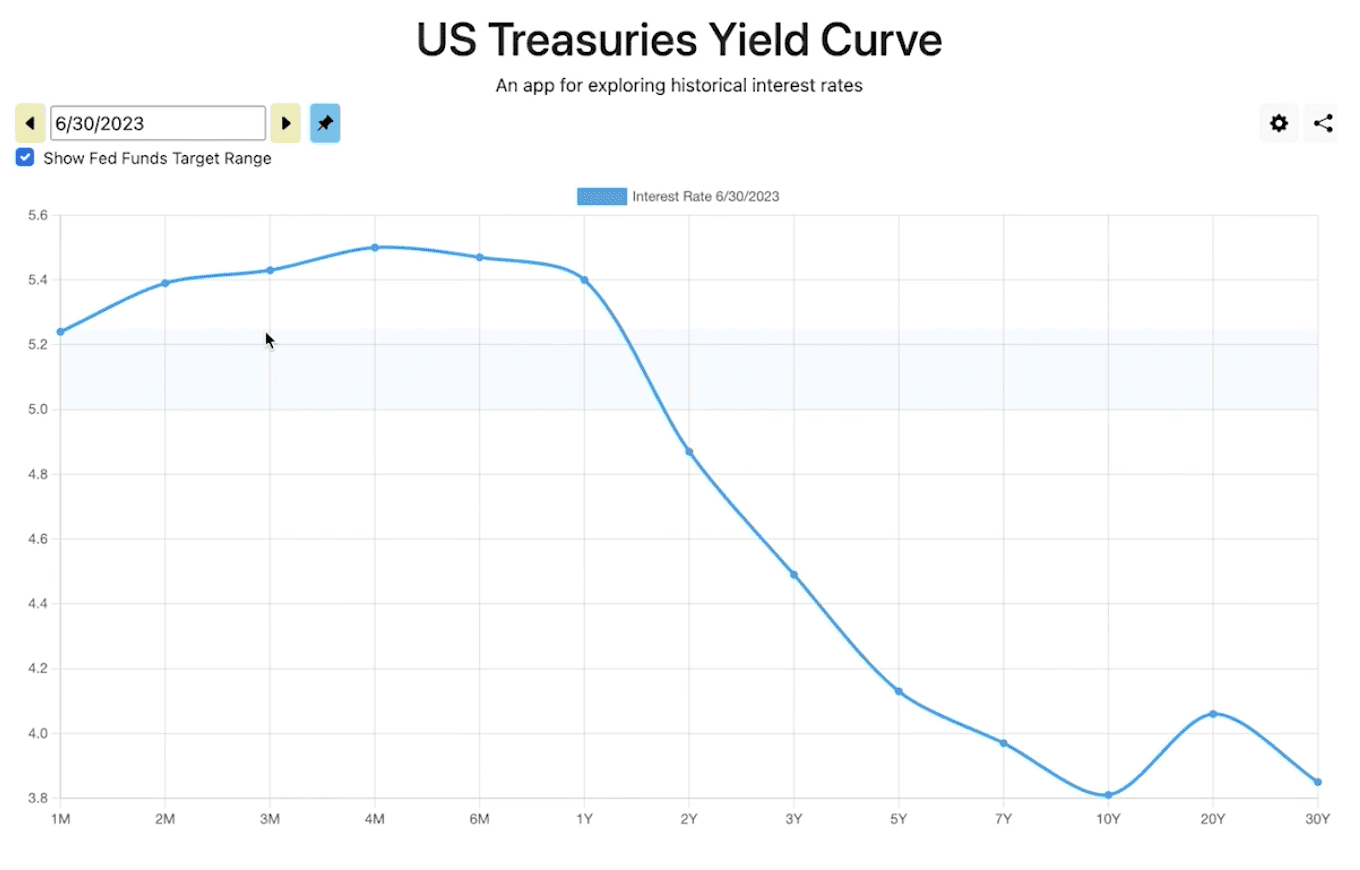
FIGURE 5 – U.S. Treasury Yield Curve on June 30
Remaining Cautiously Optimistic
So, what does all this mean for you? Caution is still the word of the day. We can be cautiously optimistic. This is one of those periods when diversification hasn’t been your friend. If you aren’t uber heavy into those seven stocks that made up the 25% of the S&P 500, your returns haven’t been very good this year and they weren’t very good last year either.
However, going back to January 1, 2022, the S&P 500 equal-weighted index is outperforming the S&P 500 cap-weighted index. In times like this, you really need to have patience. These things are normal in the market. They happen all the time.
If you’re a Modern Wealth Management client, make sure that you’re working with your financial advisor and looking at your overall financial plan, probability of success, and asset allocation. We review with you on a regular basis, but if you have questions, please reach out to us.
We also encourage you to start a conversation with us if you’re not a Modern Wealth client and have questions about what we’ve shared. It’s our hope that this was helpful for you and we look forward to answering any questions that you may have. Thank you for tuning into our October Monthly Economic Update.
Investment advisory services offered through Modern Wealth Management, LLC, an SEC Registered Investment Adviser.
The views expressed represent the opinion of Modern Wealth Management, LLC, an SEC Registered Investment Adviser. Information provided is for illustrative purposes only and does not constitute investment, tax, or legal advice. Modern Wealth Management, LLC does not accept any liability for the use of the information discussed. Consult with a qualified financial, legal, or tax professional prior to taking any action.