Dot-Com Bubble History Remains Relevant
Key Points – Dot-Com Bubble History Remains Relevant
- Remembering When the Dot-Com Bubble Burst
- Will the Dot-Com Bubble Burst Again?
- The Environment That Created the Dot-Com Bubble
- Using History and Monetary Policy to Make Educated Guesses About the Future
- 10 Minutes to Read
The Dot-Com Bubble burst 22 years ago today in the wake of many economic factors. What parallels are there between then and now? Dean Barber and Bud Kasper discuss the Dot-Com Bubble and why it’s still relevant today.
Show Resources:
Find links to the resources Dean and Bud mentioned on this episode below.
- Download: Retirement Plan Checklist
- Article: From Quantitative Easing to Quantitative Tightening
- Education Center: Articles, Videos, Podcasts, and More
Looking Back on a Monumental Day in the Markets
It was almost exactly 22 years ago on March 10, 2000, that the NASDAQ hit what was then an all-time high of 5,048.62. It was the culmination of years of speculation, IPOs, and venture capital flooding the market into technology companies affectionately referred to as Dot-Coms.
The promise of large gains from this “new economy” captured the imaginations of everyone from Wall Street insiders to the average investor that drove the NASDAQ to that lofty level from below 1,000 just five years earlier. This fervor was given the name of “irrational exuberance” by Alan Greenspan in 1996. As it turns out, he was correct. He was just about four years early in making the call.
Will the Dot-Com Bubble Burst Again?
So, why would an event that occurred over 22 years ago still be relevant to today’s investors? The answer is that even though history doesn’t always repeat itself, it often rhymes. And as you’ll see, there’s a bit of rhyming going on today. So much so, in fact, that financial writers have been concerned about a repeat of the Dot-Com Bubble bursting since early last year.
In researching for this article, I was amazed to see the sheer amount of content out there on this exact subject. While I’ll share my analysis and opinions with you on this, there’s plenty of additional material that you can read on your own.
To understand why the Dot-Com Bubble may still be relevant today, we need to know what happened to create it and what caused it to burst. So, let’s do a deep dive into this. Then, we’ll move on to what’s happening today.
The Development of the Dot-Com Bubble
The internet became a user-friendly, widely accessible experience with the introduction of the first browser, Mosaic, in January 1993. It was developed by the National Center for Supercomputing Applications (I know, I hadn’t heard of it either). Mosaic was the product of the work of Eric Bina and Marc Andreesen.
However, most households still didn’t have a computer at that time. In 1984, only 8% of households had one. By 1997, only 36.6% had one. At the peak of the Dot-Com Bubble in 2000, a majority (51%) of households owned a computer.
It’s difficult to think of that now, as we’re all walking around with a computer in our pockets that is much more powerful than the most powerful PC in 2000. These numbers are relevant when you consider the innovation/adoption curve.
The Composition of a New Technology Costumer Base
When a new technology comes to market, it takes a while to make its way into the mainstream. The first customers are usually the risk takers who have the money and the desire to try new things. They will make up between 2% and 3% of the customer base.
Then, you get the early adopters who are more selective about which technology they use. Therefore, they’ll take more time before deciding which new technologies to use. They make up the next 13 to 14% of the customer base of a new technology.
Next comes the early majority, which is the next 34% of the available customer base. They take their time before adopting new technologies and want to understand how it fits into their lives before deciding.
This brings us to the 50% level that is so critical in the innovation/adoption curve. At 50% adoption, all companies in the new technology space have collectively gotten half of the total available customers. At this point, there is inevitably a shakeout where the weaker or less nimble companies either don’t make it or are bought up by other companies to capture more of the remaining market share, which is now a finite number.
Assessing the Innovation/Adoption Curve
The survivors will go on to gather their share of the 100% of the customer base, while the others will be forgotten. This rise and fall of the innovation/adoption curve has happened innumerable times in our history and continues to this day.
Without searching the internet, I would bet that no one today (outside of a buggy whip historian…if there is such a thing) can name a single buggy whip company. Most people probably don’t even know what a buggy whip is. However, it was a thriving industry at one point in history. It was just displaced by the new technology of the time—the automobile.
You can see that the curve affects every new technology by checking out this list of defunct automobile manufacturers in the United States and comparing it to this much smaller list of current US automobile manufacturers. This is also shown below in Figure 1.
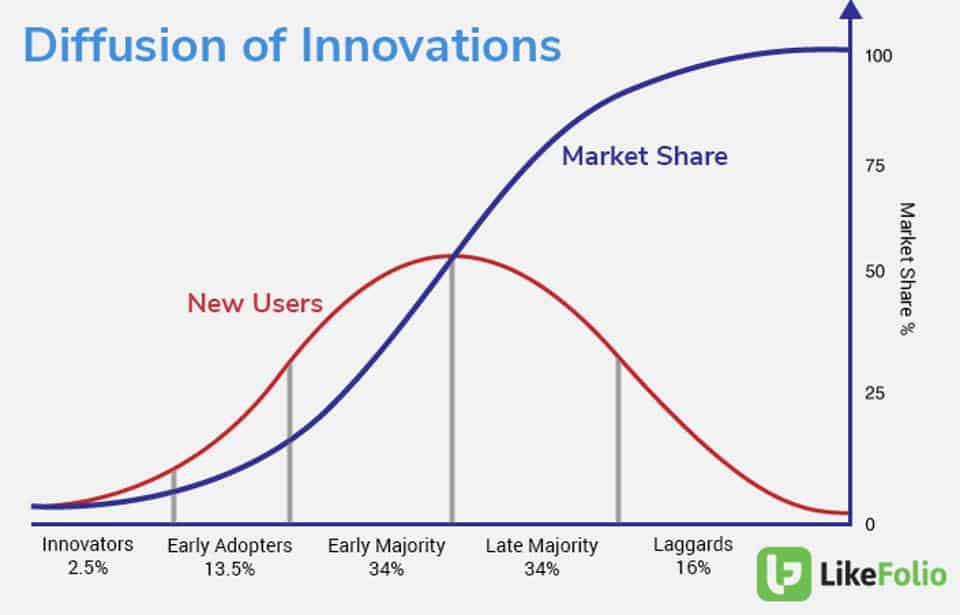
FIGURE 1 | Diffusions of Innovations | LikeFolio
The Environment That Created the Dot-Com Bubble
Flash back to the 1990s and you can see the same kind of phenomenon. The Federal Reserve dropped the overnight interest rate from over 9% in October 1990 to below 3% by December 1992.
The Telecommunications Act of 1996 and the Taxpayer Relief Act of 1997 eased regulations in the telecommunications industry and dropped the marginal tax rates and capital gains tax rate. Thus, the perfect environment for capital flowed into the markets and provided the fuel for the inflation of the Dot-Com Bubble.
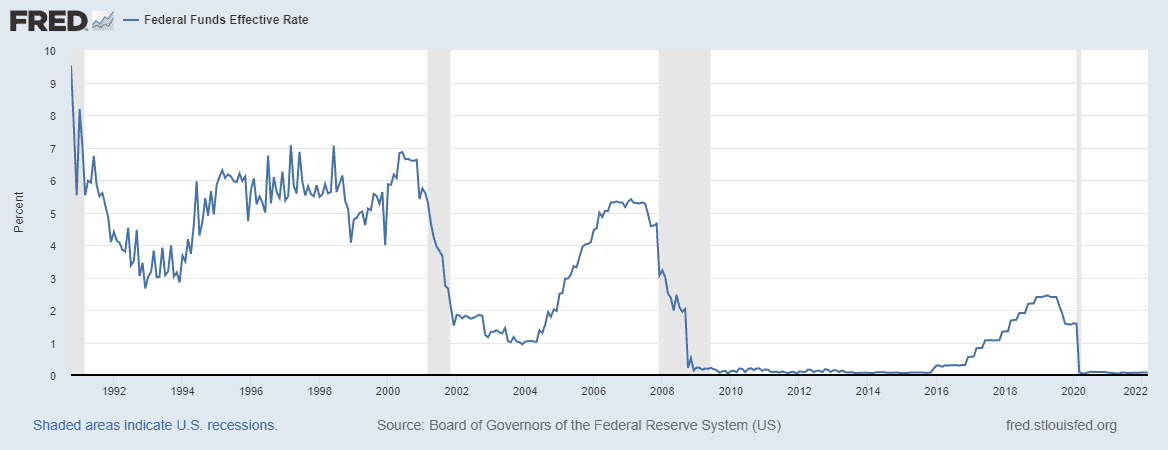
FIGURE 2 | Federal Funds Effective Rate | Board of Governors of the Federal Reserve System
Below in Figure 3, you can see how quickly the Dot-Com Bubble inflated and catastrophically it burst. The reasons behind the inflation of the bubble are what we’ll discuss next.
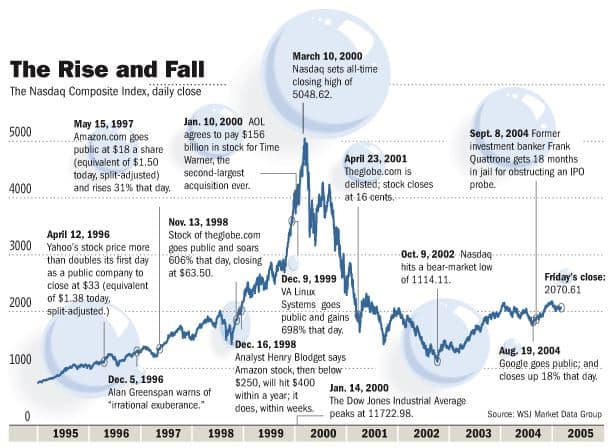
FIGURE 3 | The Rise and Fall | Global Entrepreneurship Institute
Venture Capital investments in the late 1990s—outlined in Figure 4— absolutely exploded. It seems like it didn’t matter what the venture was, someone was willing to pour money into it.
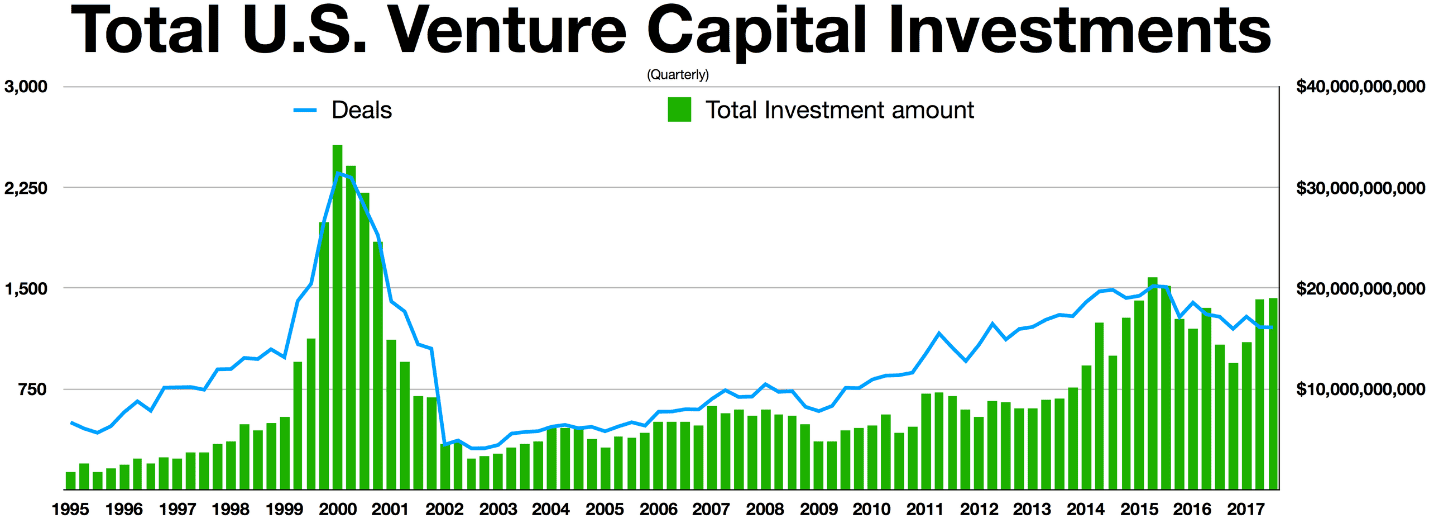
FIGURE 4 | Total U.S. Venture Capital Investments | PwC MoneyTree
Get Big Fast
This is a key point to what inflated the Dot-Com Bubble. Most, if not all, of the Dot-Com companies that were springing up daily had zero earnings. All they had was an idea. They needed funding to make that idea (hopefully) a reality.
The motto for the Dot-Com companies was “Get Big Fast.” That required a ton of cash that had to come from somewhere. Venture Capitalists were more than happy to oblige. These companies were devoid of any earnings. They would then have an initial public offering (IPO) and magically go from unknown to being worth millions (sometimes billions) of dollars almost overnight. After that, they would spend those dollars on lavish advertising campaigns to gain attention and users.
The best and worst example of the Dot-Com company commercials occurred in Super Bowl XXXIV in January 2000. It was later dubbed as the Dot-Com Super Bowl because there were 14 different Dot-Com companies that ran ads. Those ads averaged $2.2 million per spot and made up nearly 20% of the advertising during the Super Bowl. Of those 14 companies, only four are still active today. Five were bought by other companies and five others are relegated to the ash heap of history.
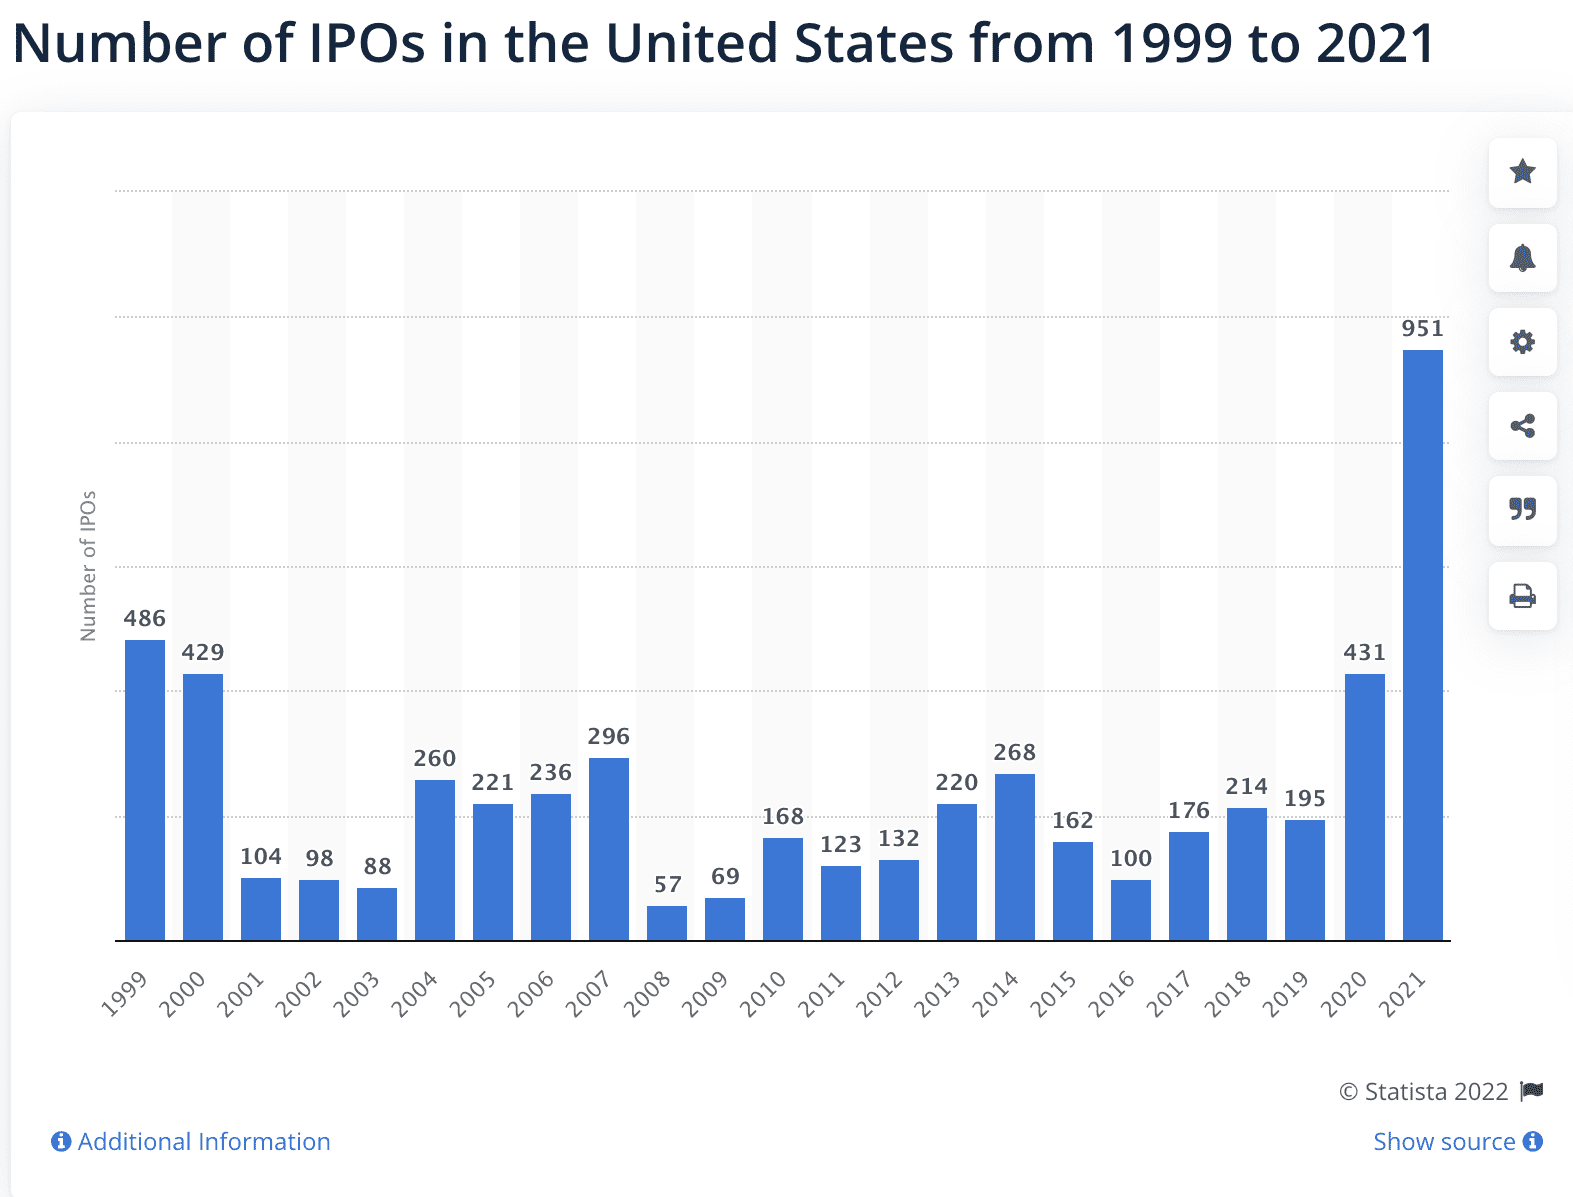
FIGURE 5 | Number of IPOs in the United States from 1999 to 2021 | Statista
Do You Remember theGlobe.com?
As you can see above in Figure 5, 1999 and 2000 had a combined 900-plus IPOs in the United States. Most of those IPOs were Dot-Com companies that had been the beneficiaries of the influx of Venture Capital investments. The public bought into the hype as soon as they had the opportunity to buy shares too. Typical IPOs of non-Dot Com companies saw first day increases averaging 16% or so. It was not uncommon, though, for Dot-Com IPOs to double or triple in value on day one. The highest profile example of that is the now defunct company, theGlobe.com.
TheGlobe.com was started by two Cornell students who had purchased an Apple internet server with $15,000 they raised over the 1994 Christmas break. They founded a programming company named WebGenesis and developed theGlobe.com as their primary website. They took the website live on April 1, 1995 and attracted 44,000 visits in their first month. In 1997, they secured financing from Dancing Bear Investments.
Though they had no revenue other than the financing, they took salaries that year exceeding $100,000 and revenues from preferred shares of $500,000 each. Those two Cornell students were 23 at the time. In November 1998, they issued their IPO. The target price was $9 a share. Not surprisingly, given the mania of the time, the first trade was at $87 a share. The trading day ended with the stock at $63.50 per share, a gain of 606% in one day. The pair were worth close to $100 million each by the end of the day.
Margin debt—or borrowing against securities you own to buy more securities—saw a huge increase in the late 1990s as investors sought to capitalize on the Dot-Com mania.
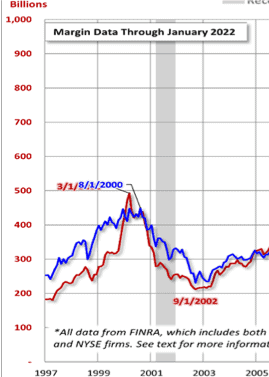
FIGURE 6 | Margin Data Through January 2022 | Advisor Perspectives
The Beginning of the End of the Dot-Com Bubble
Figure 6, above, is part of a larger chart that we’ll review in a bit. It clearly shows how much leveraged money was pouring into the market. The peak was $300 billion in 2000’s dollars, which equates to $500 billion today.
It’s worth noting that margin debt not only peaked in March 2000, but so did the NASDAQ and the amount of Venture capital. The fact that all three of these things peaked at the same time is perfectly evident in hindsight, but almost no one saw it for what it was when it happened. And what it was, was the beginning of the end for the Dot-Com Bubble.
Dell, Cisco, and several other tech companies placed sell orders on their own stock after the March 10 peak, which sparked panic selling among investors. You know, those same fickle people we talked about in my article, War and the Markets. Most of the Dot-Com true believers were undeterred and saw this as an opportunity to buy the dip on what they thought was a normal correction. Sadly, for them, it was not.
The Pin That Popped the Dot-Com Bubble
By the time 2000 rolled around, the Federal Reserve had raised the overnight rate back up to 7%. That made borrowing more expensive and capital less readily available. Slowly but surely, the Venture Capital began to exit, as did the margin debt cash. On their way out the door, they stuck a pin in the Dot-Com Bubble.
The NASDAQ then crashed by 78% over the next two years. It finally bottomed out at 1114.14 on October 9, 2002. In the wake of the bubble bursting, several Dot-Com companies that had supposedly been worth hundreds of millions of dollars became worthless in the span of just a few months. It took 15 years for the NASDAQ to regain the value it had lost from its previous peak in March 2000, retaking that level in April 2015.
The Dot-Com Bubble’s Rhyming Relevance
So, what are the reasons all of this is still relevant today? Other than the fact that it looks like history is rhyming, there may not be any reasons. But that fact alone may be the only reason we need.
We’ve seen this movie before, with some of the same cast. The director may just be different this time. Let’s start with the Venture Capital today.
Venture Capital, IPOs Nearly Double from 2020 to 2021
Venture Capital nearly doubled in 2021 from 2020, in deals worth nearly $350 billion. You can see that below in Figure 7 from PitchBook, which tracks Venture Capital deals and activity. Figure 7 shows markedly increased activity from 2018 on, including that big spike in deal value last year. It’s impossible to tell if this year will be higher than 2021, but given all the geopolitical uncertainty, I would be surprised if it did. Time will tell. What I do know is that this is quite similar to what we saw the last time Venture Capital was flowing like it did last year.
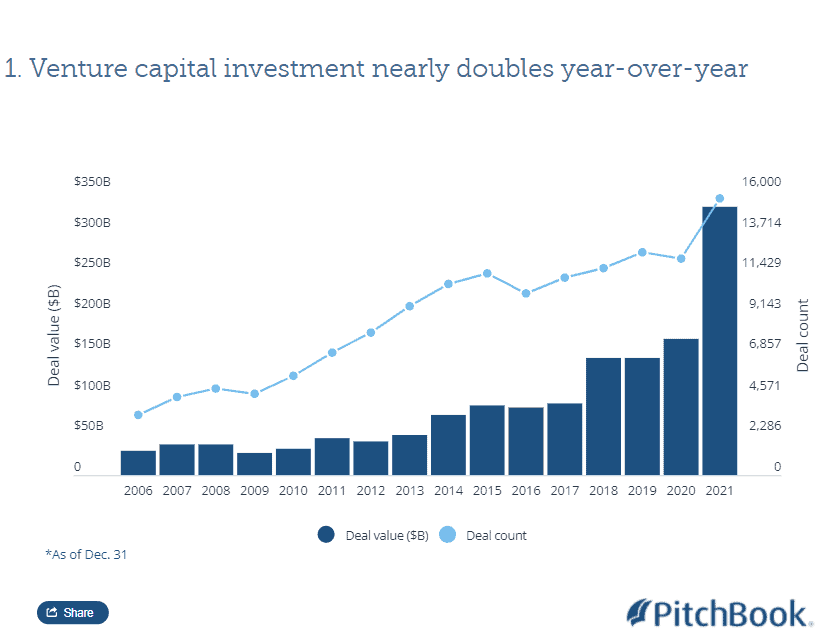
FIGURE 7 | Venture Capital Investment Nearly Doubles Year-Over-Year | PitchBook
We saw a huge jump in in the IPO space in 2021. It also nearly doubled the activity from 2020, which you can see in Figure 8. 2021 alone saw more than 1999 and 2000 combined.
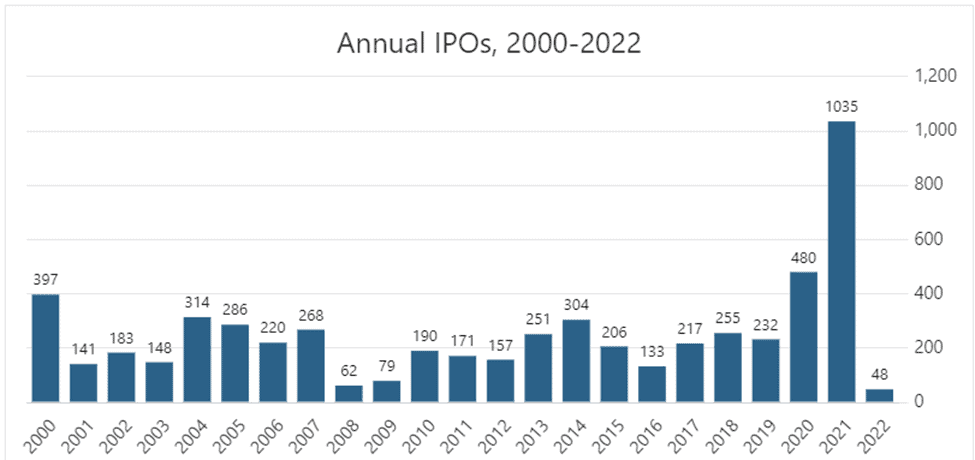
FIGURE 8 | Annual IPOs, 2000-2022 | Seeking Alpha
But Let’s Go Back to Margin Debt
Then, there’s margin debt, which is outlined in Figures 9 and 10. Once again, we see a peak in margin debt that occurred last year. Margin debt peaked in October at nearly $1 trillion. It has since been declining and shows no signs of turning around yet.
To be fair, margin debt stats from FINRA only come out monthly. The most recent data (to the end of February) isn’t available yet. But nevertheless, there is a clear correlation between margin debt and the market. If that number doesn’t turn around, there could be some pain ahead. Time will tell.
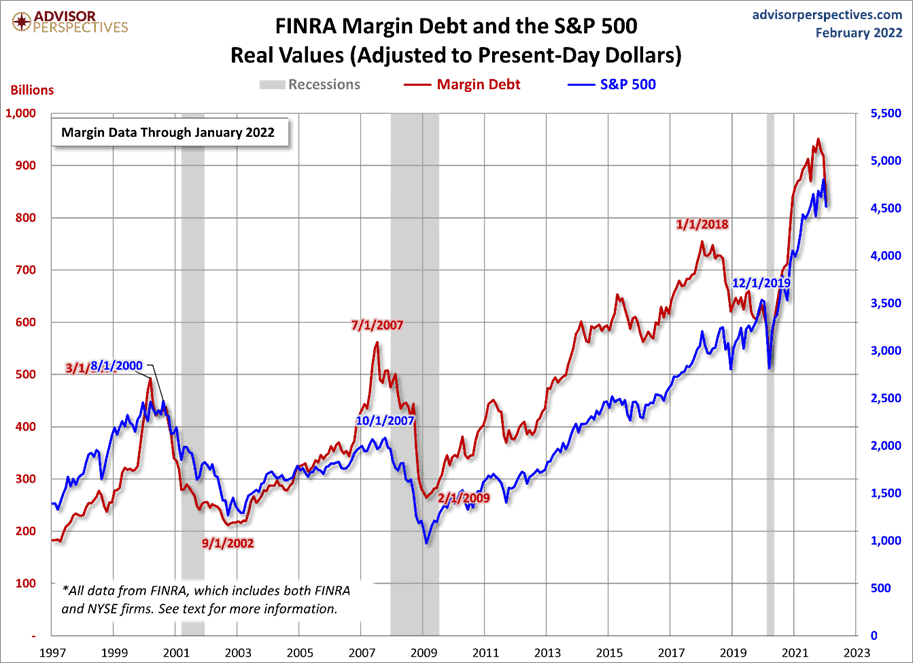
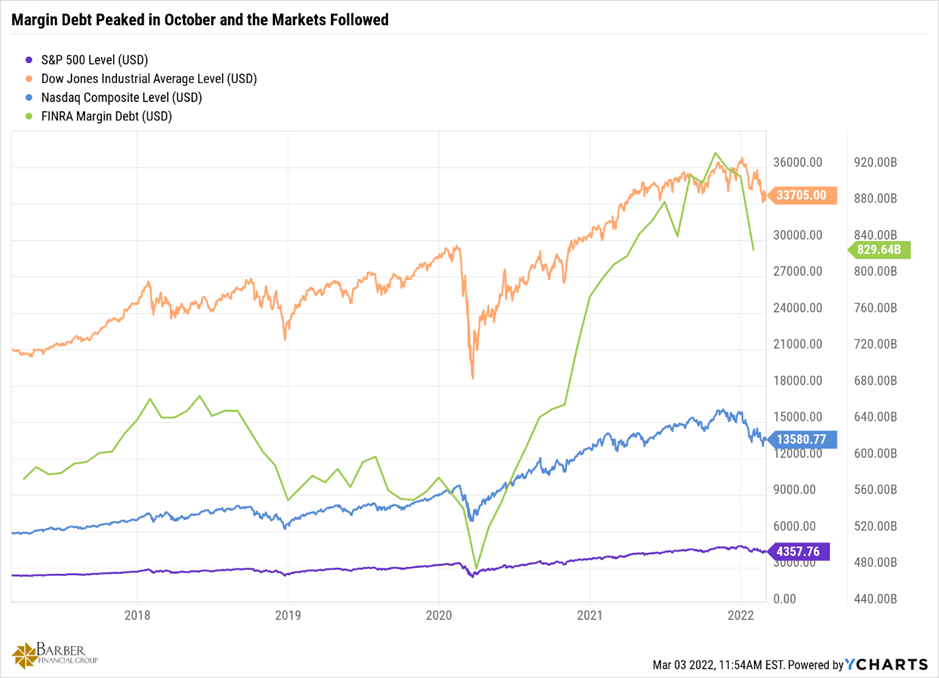
FIGURE 10 | Margin Debt Peaked in October and the Markets Followed | YCharts
Then and Now: The Fed Raising the Overnight Rate
And then there’s the Federal Reserve and the overnight rate. As you saw earlier in Figure 2, the overnight rate is now at 0% to 0.25%, so basically zero. The last time the Fed tried to raise the overnight rate back to something more normal was back in 2016 to 2018.
When they got to 2%, the market threw a fit and dropped rapidly. That ended up being referred to as the Taper Tantrum. Not only was the Fed raising rates, but they were pulling liquidity from the market at the same time. Sound familiar? 2000?
Well, it’s also going to be that way in 2022. The Fed has indicated that it will likely raise rates between four and seven times this year, putting the overnight rate between 1% and 2% by the end of the year.
They have also announced their intentions to begin reducing their balance sheet of $9 trillion and pulling liquidity from the market to slow the inflationary pressure we’re currently experiencing. That would mean less money available for speculative investment, less money available for borrowing, and a higher cost to borrow the money that is available.
Oh, and let’s not forget higher tax rates on capital gains if you fall into certain income levels. So, peak Venture Capital, peak margin debt, peak IPOs, rising interest rates, and higher taxes.
Will We Recognize the Next Dot-Com Bubble?
Looking back at the Dot-Com Bubble, it’s painfully obvious what it was. But will we recognize the next one? The blue line in Figures 11 and 12 are the NASDAQ, which is a technology stock index. Look at the peak in 2000 and then recently. Is that a bubble too?
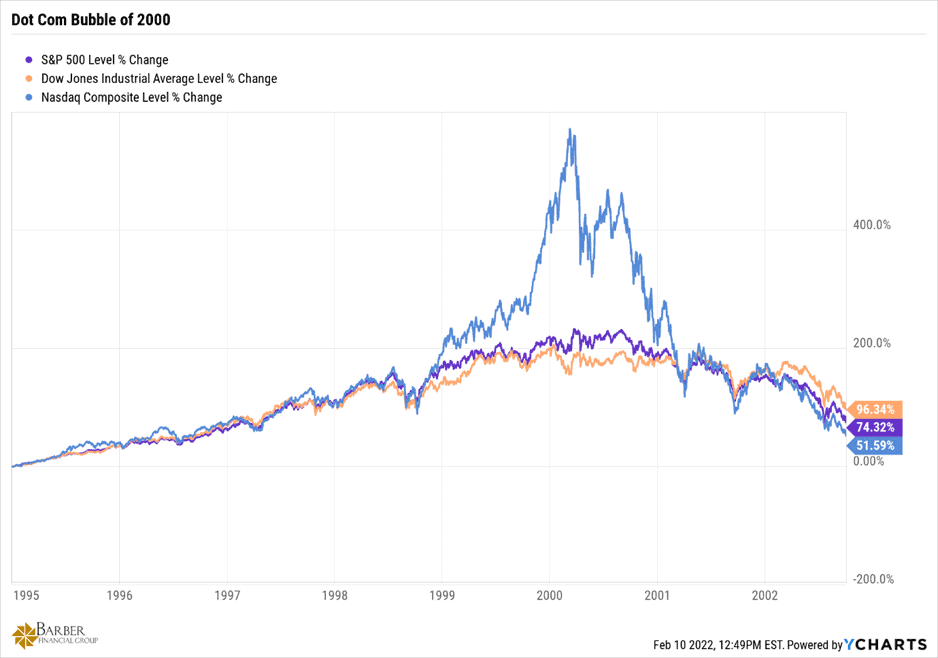
FIGURE 11 | Dot-Com Bubble of 2000 | YCharts
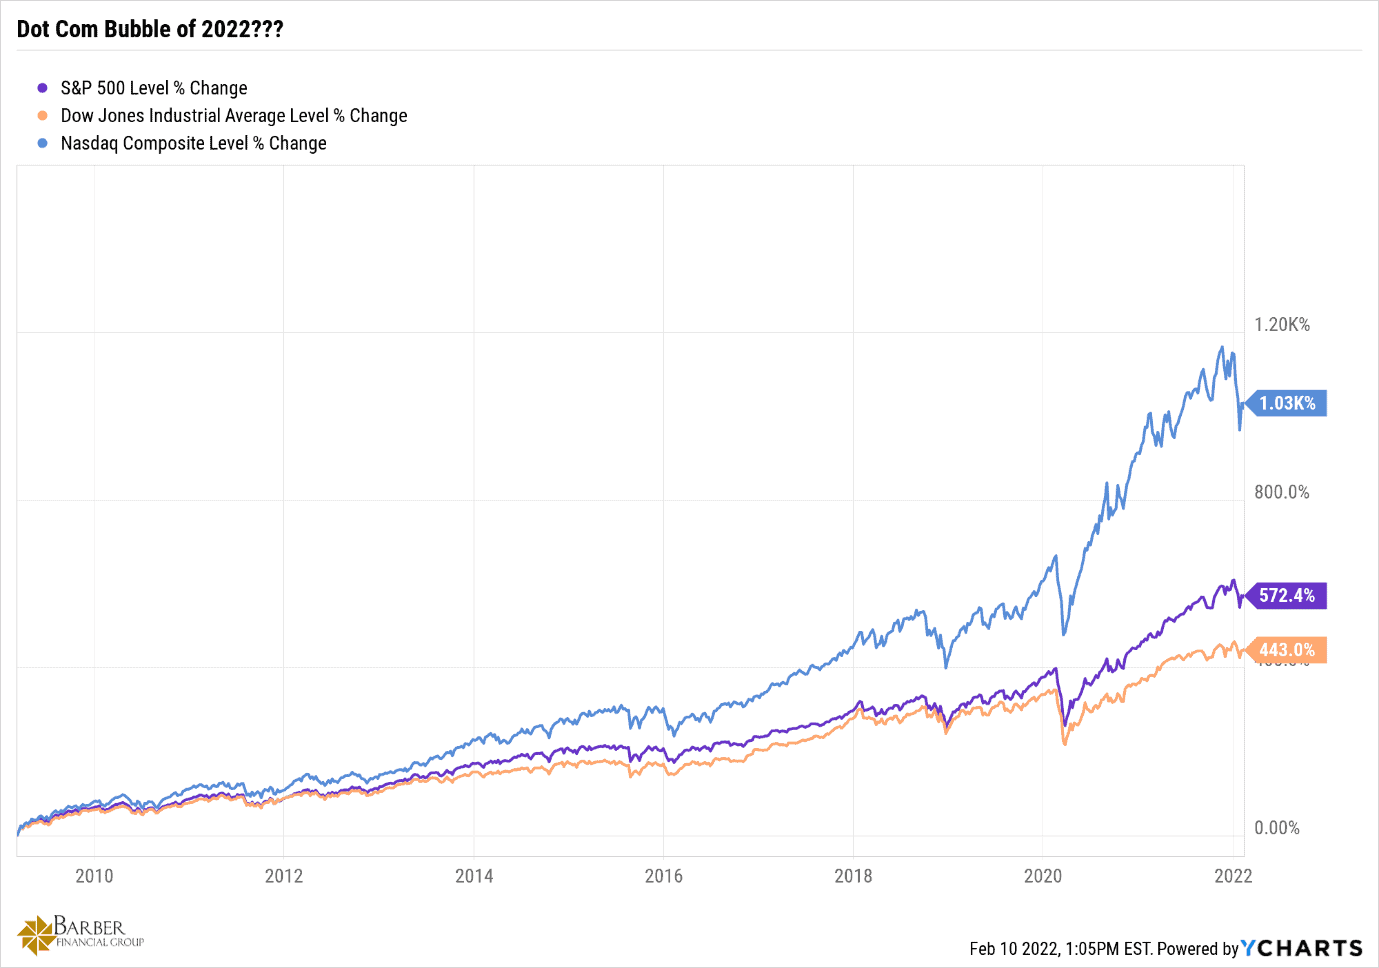
FIGURE 12 | Dot-Com Bubble of 2022??? | YCharts
Figures 13 and 14 show the three to five years leading up to the 2000 peak and the most recent peak. The divergence between the Dow Jones Industrial Average and S&P 500 in Figure 13 versus Figure 14 is more, because there were no Dot-Com stocks or technology stocks in the Dow or S&P in 2000. So, the Dot-Com Bubble in 2000 really set the NASDAQ apart from its Industrial and large company cousins, the Dow and the S&P 500.
Today, technology companies make up almost 18% of the Dow and 25% of the S&P. The same companies in those two indexes are also in the NASDAQ. That makes the chances of a divergence as big as the one in 2000 unlikely. But the divergence is still quite remarkable, despite the presence of tech in the other two indexes now.
Using History and Monetary Policy to Make Educated Guesses About the Future
And, with history and monetary policy as our guides, we can make educated guesses about what may be next. Those guesses, at this point, are complicated by the presence of a shooting war between Russia and the Ukraine, which may have consequences well beyond the borders of their respective countries. But setting those things aside for a moment, we may well be at the tipping point for second Dot-Com Bubble.
Things can and do change. We may well see the indexes higher by the end of the year. I hope so. In fact, I expect so. But I think it’s important to keep in mind where we are from a historical perspective. And we’re closer to the top than we are to the bottom.
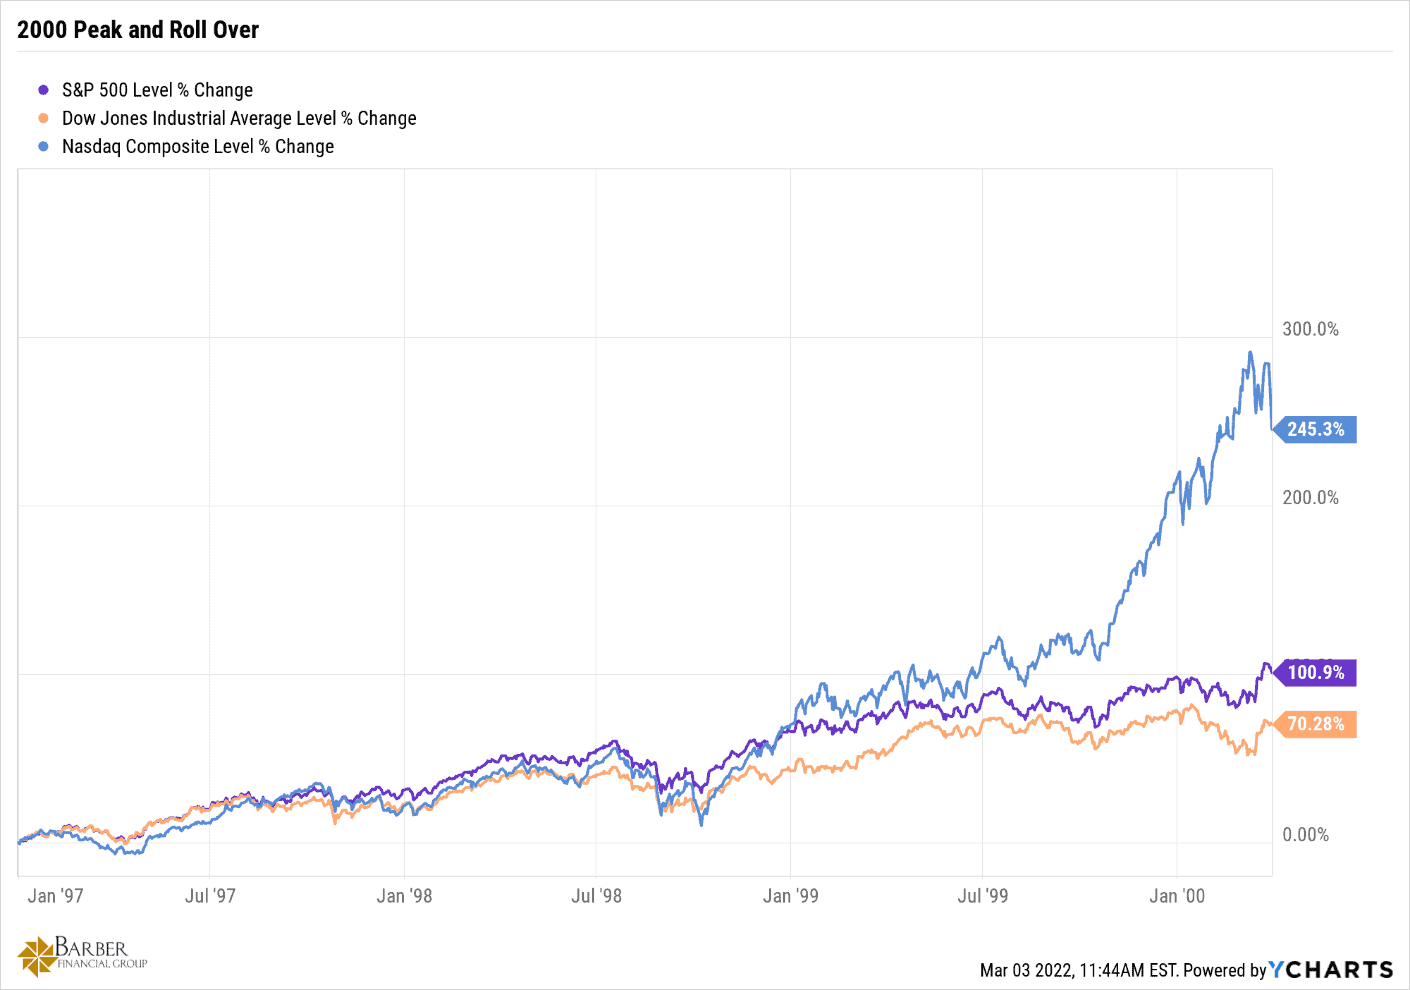
FIGURE 13 | 2000 Peak and Rollover | YCharts
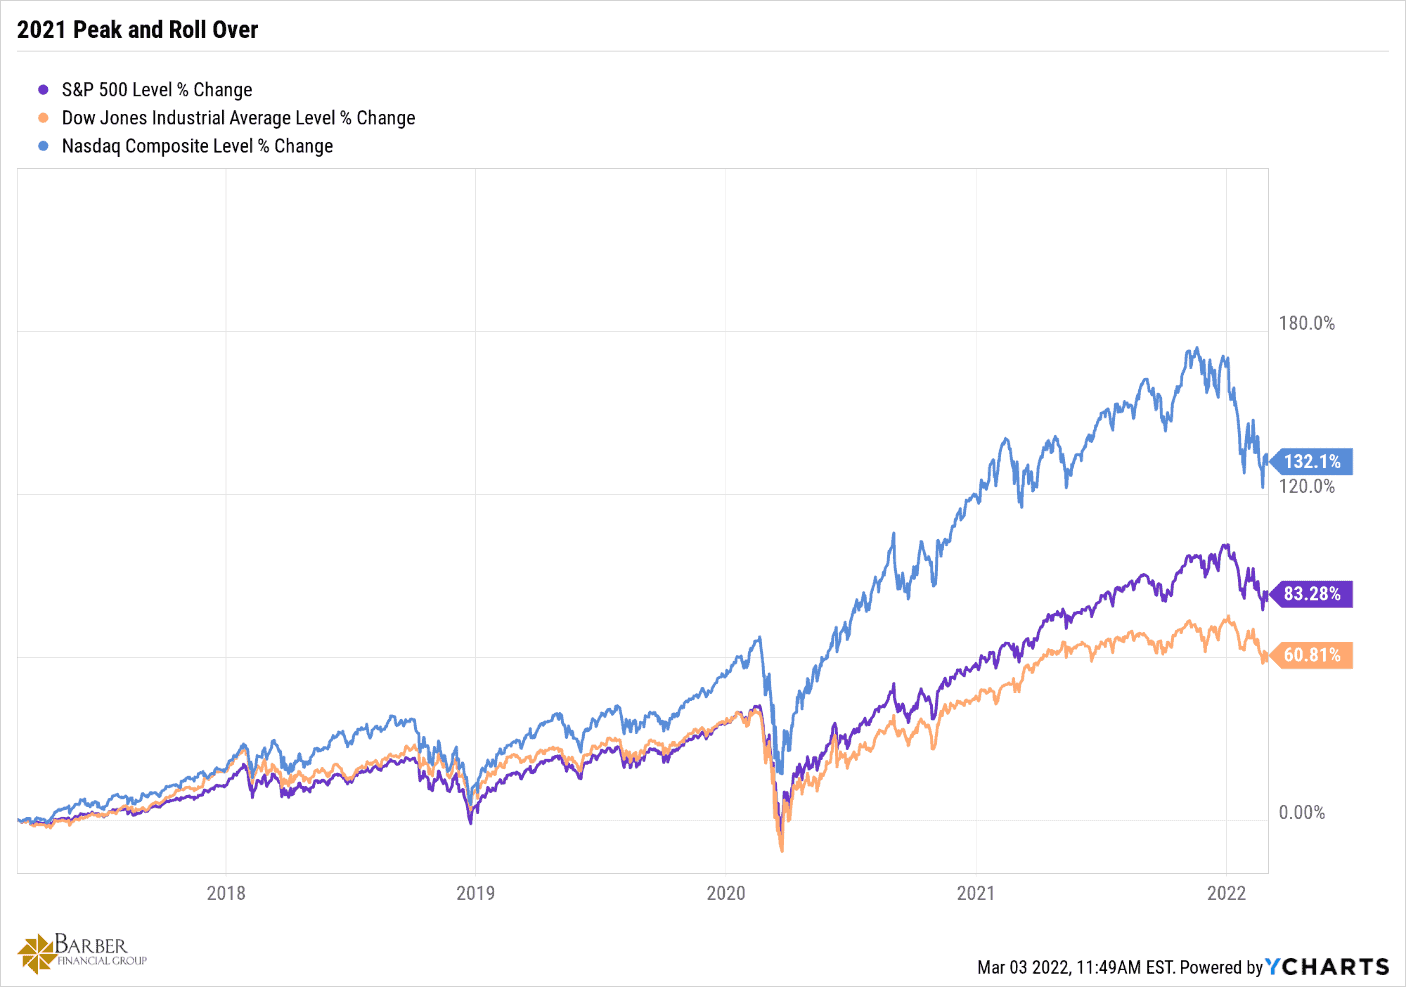
FIGURE 14 | 2021 Peak and Rollover | YCharts
In closing, the Dot-Com Bubble of 2000 matters today because of what it can teach us. I hope everything that I’ve shared has helped give you a more in-depth historical perspective so you can make an informed decision about where you think we are in the cycle.
Have a wonderful week, and thanks for joining me in reviewing the history of the Dot-Com Bubble and how it relates to the present.
Schedule Complimentary Consultation
Select the office you would like to meet with. We can meet in-person, by virtual meeting, or by phone. Then it’s just two simple steps to schedule a time for your Complimentary Consultation.
Lenexa Office Lee’s Summit Office North Kansas City Office
Investment advisory services offered through Modern Wealth Management, Inc., an SEC Registered Investment Adviser.
The views expressed represent the opinion of Modern Wealth Management an SEC Registered Investment Advisor. Information provided is for illustrative purposes only and does not constitute investment, tax, or legal advice. Modern Wealth Management does not accept any liability for the use of the information discussed. Consult with a qualified financial, legal, or tax professional prior to taking any action.