Corporate Earnings and Why They Matter
Key Points – Corporate Earnings and Why They Matter
- It’s All About Net Profit
- How to Calculate Earnings Per Share
- The Bureau of Economic Analysis Explains the Importance of Corporate Earnings
- How Are Corporate Earnings Tracked?
- PE Ratios Explained
- The Relationship Between Earnings Per Share and Employment
- 9 Minutes to Read
What Are Corporate Earnings and Why Are They So Important?
If you listen to any financial media, you’ll hear them talk repeatedly about “corporate earnings.” To give you an idea of how much talk there is about corporate earnings, a quick Google search of the term will net roughly 400 million results in about half a second. So, obviously corporate earnings are important to a lot of people. But what do they mean, and why are they so important? Today, we’re going to discuss just that.
First, let’s define what they are referring to. For the uninitiated (probably most of us), the term earnings may be used interchangeably with revenue in discussing a business. And while earnings and revenue are important to a business, they are not what’s most important. The most important thing is profit. Net profit to be exact. That’s the amount of the revenue or earnings that the company gets to keep after all expenses and taxes are paid.
Examples of Earnings Per Share
This is then used to calculate what is known as Earnings Per Share (EPS). And a company’s EPS is exactly what the financial world is concerned with. It’s what they are referring to when they talk about corporate earnings or profit.
A company’s basic EPS is calculated by dividing their net profit by the number of outstanding shares of its stock. For example, if a company had $100 million net profit with 10 million shares of stock outstanding, it’s EPS would be $10. However, a company with the same $100 million net profit that had 100 million shares of stock outstanding would have an EPS of $1. Which company would you want to buy stock in? The answer is, maybe both. But that’s another discussion for another day.
The Importance of Corporate Earnings Explained by the Bureau of Economic Analysis
Corporate earnings/profits are closely tracked by many entities, not the least of which is the Bureau of Economic Analysis. Look at how the BEA describes the importance of corporate profits.
“Corporate profits represent the portion of the total income earned from current production that is accounted for by U.S. corporations. The estimates of corporate profits are an integral part of the national income and product accounts (NIPAs), a set of accounts prepared by the BEA that provides a logical and consistent framework for presenting statistics on U.S. economic activity.
“Corporate profits are one of the most closely watched U.S. economic indicators. Profitability provides a summary measure of corporate financial health and thus serves as an essential indicator of economic performance. Profits are a source of retained earnings, providing much of the funding for capital investments that raise productive capacity. The estimates of profits and of related measures may also be used to evaluate the effects on corporations of changes in policy or in economic conditions.”
Earnings Season
Corporate earnings are so important that they even have their own season known as earnings season. There are countless sites that have an earnings calendar, so you can see when your favorite company is going to post its earnings, and for which quarter they are reporting. For example, look at the Yahoo Finance Earnings Calendar. There is a lag in earnings reporting, which can sometimes be extensive. The data for the fourth quarter of last year won’t be finalized until the end of the first quarter of this year, which you can see here in below in Figure 1.
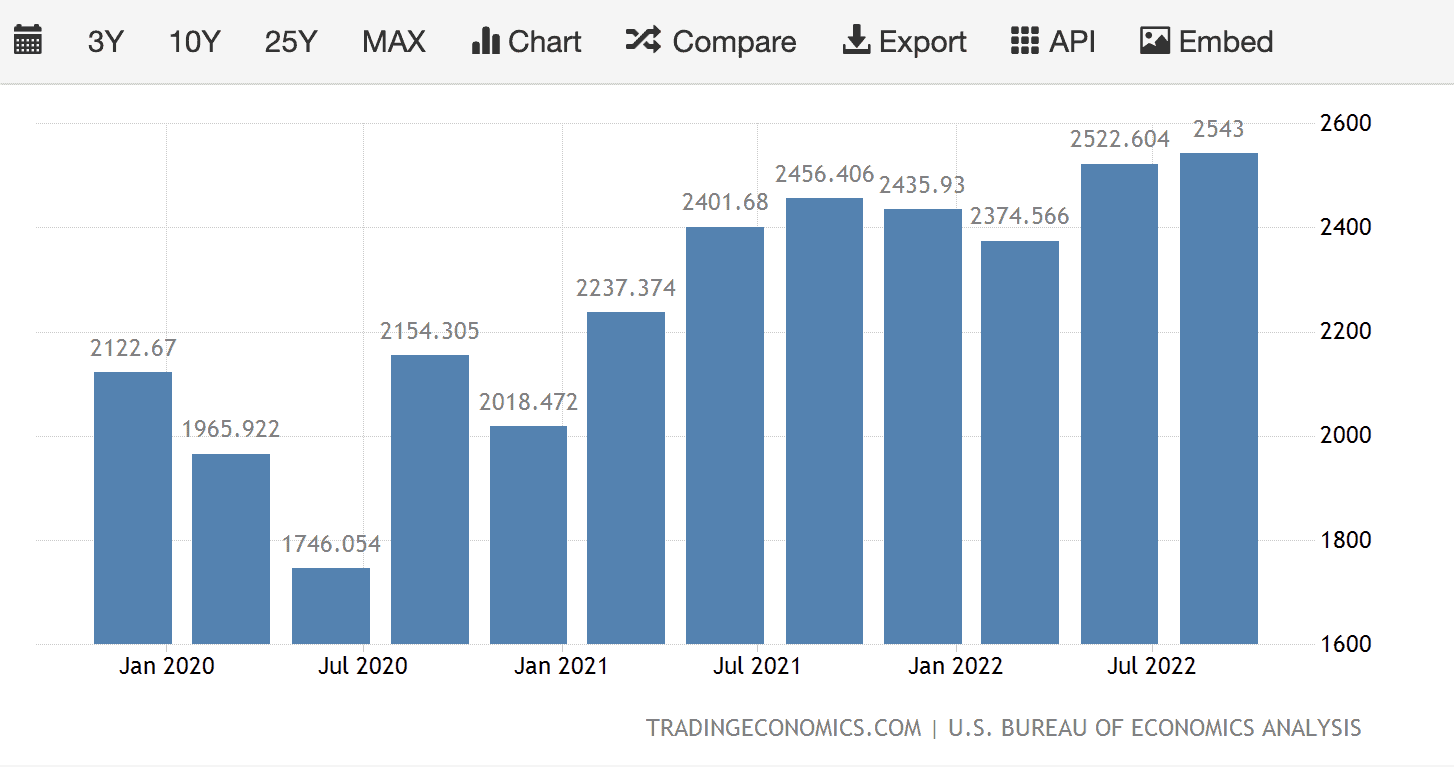
FIGURE 1 – United States Corporate Profits – Trading Economics
That lag in finalized data makes it difficult to use the data for anything except a directional trend indicator, rather than an immediately actionable indicator. In Figure 1, you can also see that there are errors in estimates until the final data is in. In November, the preliminary estimate of Q3 profits was for a 0.2% drop, but the final number a month later showed a 0.8% increase. If you had acted on the preliminary data, you may have made a bad decision.
Keeping Up with Data Trends
So, since the data lags, why is it important? As I mentioned before, the trends the data show are what’s important, as they tell us a lot about a lot of segments of the economy and what may be coming next. A few examples are, the rate of growth of the economy as measured by Gross Domestic Product (GDP), the financial health and attitude of the consumer, the future rate of inflation, the future of unemployment and layoffs, the direction the equities market is likely to take, and the financial health and attitudes of the business community as a whole.
Price-to-Earnings Ratios
Enter the price-to-earnings ratio (PE). The PE of a company is used to assess whether the price of their stock is low, fairly valued, or high. It is calculated by dividing the price of the stock by the EPS. For example, a company whose stock price is trading at $100 dollars per share and has an EPS of $5 dollars would have a PE ratio of 20. The PE ratio basically tells us how long it will take to get $100 dollars of income per share of stock. In this case, 20 years.
The historical average PE ratio is around 15, so our hypothetical company’s PE would be a little higher than average, but not necessarily overvalued. A higher PE ratio may indicate that the market expects the company to experience more robust growth in the future, so they are willing to pay more for their shares today in exchange for the expected growth of the company.
The 500 companies listed in the S&P 500 currently have a combined PE of about 22. At the beginning of the pandemic, they had a PE of 22.78. In the aftermath of the pandemic in December 2020, the PE of the S&P 500 was 39.26. The reason is that the market prices of the stocks of those 500 companies had recovered as optimism returned, but the earnings were still relatively low, causing the elevated PE ratio.
That brings up a key point. There are two ways for elevated PE ratios to be lowered. One, earnings go higher, making the ratio lower. Or two, prices come down, making the ratio lower. Number one is good; number two is not. Which brings us back to the focus on EPS.
Circling Back to EPS
Whether EPS are rising or declining is useful information to have when making assumptions about the future state of a company or the economy. Let’s take the examples from earlier and apply the basics of a rising and declining EPS trends to them to see how they are used in projections of future economic activity.
Gross Domestic Product
We’ll start with the broadest measure of our economy, the Gross Domestic Product. It’s the total of all the goods and services produced in the economy on a quarterly and annual basis. Like earnings reports, final GDP measurements are reported a full quarter after the quarter being measured. So, GDP for the first quarter of this year won’t be finalized until the end of the second quarter.
However, declining EPS in companies across the board would indicate that the economy is slowing and that, as a result of that slowing, we should expect GDP to be lower than we would have otherwise expected. Conversely, if EPS are rising broadly, that would indicate an expanding economy and therefore a higher GDP than we would have otherwise expected.
The consumer (i.e., people that spend money in the economy, which is everyone with any kind of income) is responsible for roughly 70% of our GDP. It’s key to know how they are doing financially and what their attitude is about the economy. There are many ways this is measured, like the Consumer Confidence Index and personal consumption expenditures.
We can also get some data on their attitudes about spending money by looking at the EPS of the companies in the consumer discretionary segment of the economy. These are companies that make non-essential or discretionary items for public consumption.
When the consumer feels pinched financially, they will avoid spending money on these non-essential items, causing the EPS of these companies to fall. On the other hand, if the consumer is flush with cash and feels confident in their economic world, they’ll spend money on those discretionary items much more frequently, causing the EPS of the companies in that segment to go higher.
Inflation
Then, there’s inflation. Of course, we measure inflation directly in several different segments. There’s price inflation, producer price inflation, food inflation, core inflation, core inflation minus food and energy—the list goes on. We can see where inflation may be headed using EPS data as well.
Rising EPS data suggests there is strong demand for a company’s goods and services and that they have pricing power over those same goods and services. That is inflationary in nature. Falling EPS share data suggests just the opposite. It indicates that demand is waning or that the prices they are charging for their goods and services may be killing demand that would otherwise exist. Either way, the natural consequence of this phenomenon is lower prices. On a broad scale, it will bring inflation in check and can lead to disinflationary pressure.
Unemployment and Layoffs
That brings us to the next thing from the examples we mentioned earlier, which is unemployment and layoffs. Just like with inflation, we measure unemployment in a plethora of ways. I’ll spare you the list, but if you want to see some of them, you can check them out here.
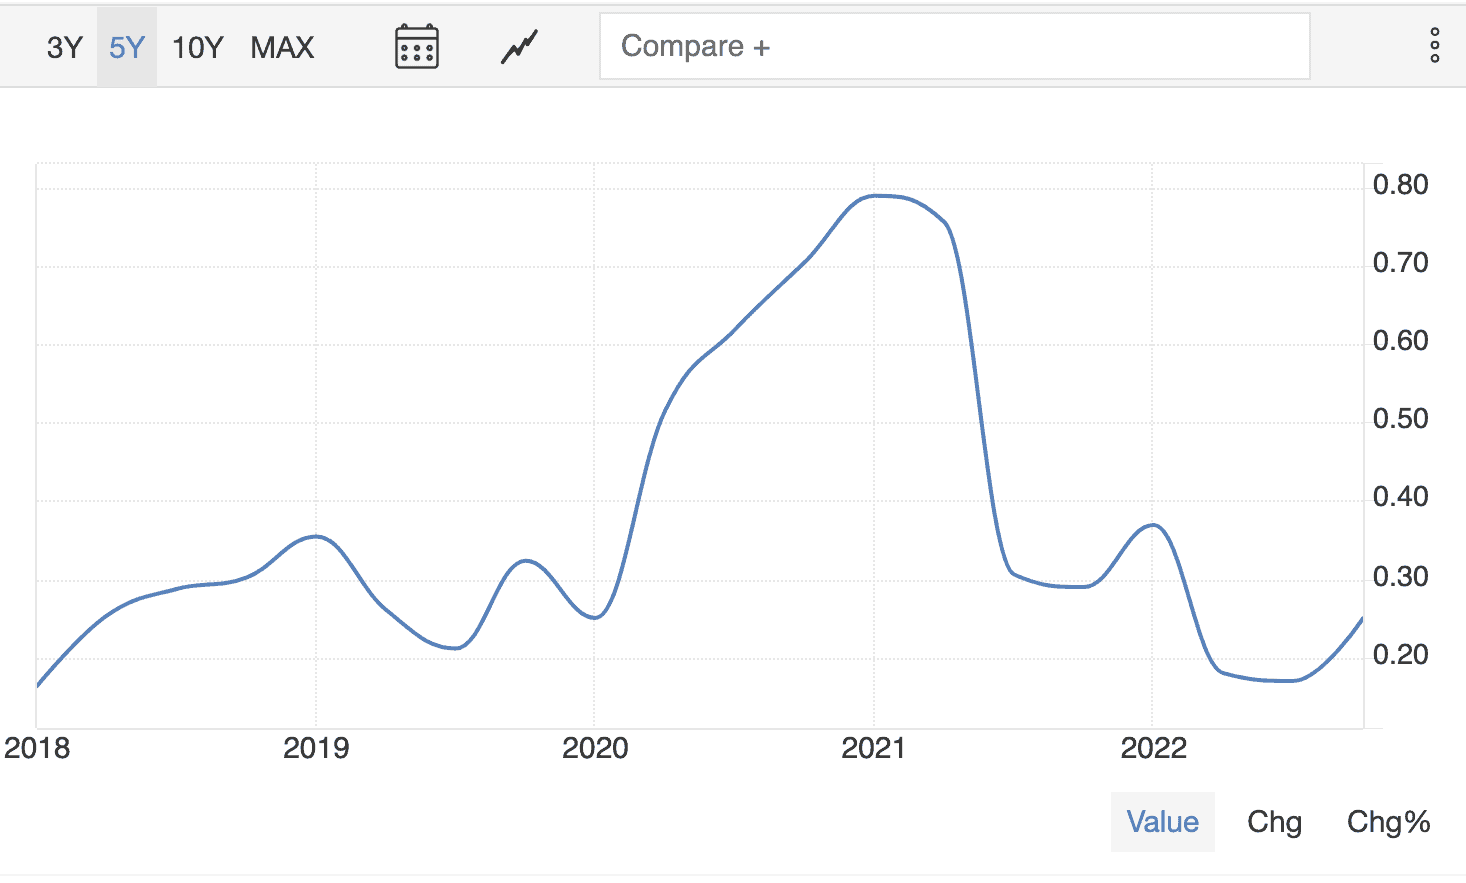
Let’s use Amazon as an example here. They recently announced that they are going to begin another round of job cuts, laying off up to 18,000 workers. Why, you ask? The answer is easy. Their EPS have cratered in the last 24 months, falling from just under 79 cents per share at the beginning of 2021 to 25 cents per share at the end of last year.
Falling EPS in individual companies tells you about the fate of some of their workers. But falling EPS in a broad base of companies or industries tells you about the direction of the unemployment rate and how widespread the wave of layoffs is likely to be.
Rising EPS, Rising Employment … and Falling EPS, Rising Unemployment
You may recall that Amazon really bulked up on personnel in the middle of the pandemic to help meet the massive wave of demand caused by folks having to shop from home. That be paid off for them in the short term, driving their EPS up to 79 cents from just 21 cents pre pandemic. Rising EPS, rising employment. Falling EPS, rising unemployment.
Potential Direction of the Stock Market
Let’s wrap this up with the potential direction of the stock market as it relates to EPS reports. We’ll use Amazon again as our example. It is glaringly evident in Figure 3 below that the falling EPS took Amazon’s stock price south with it. The earnings per share collapse has caused the price of the stock to fall by roughly 50% since its recent peak in 2021.
This a perfect illustration of the bad way for a PE ratio to correct. The good way is for the EPS to grow to support the price of the stock. Unfortunately, that didn’t happen. Imagine if this effect were to become widespread among a lot of companies and sectors of the economy. That’s why keeping an eye on corporate earnings and what they can tell us is so important.
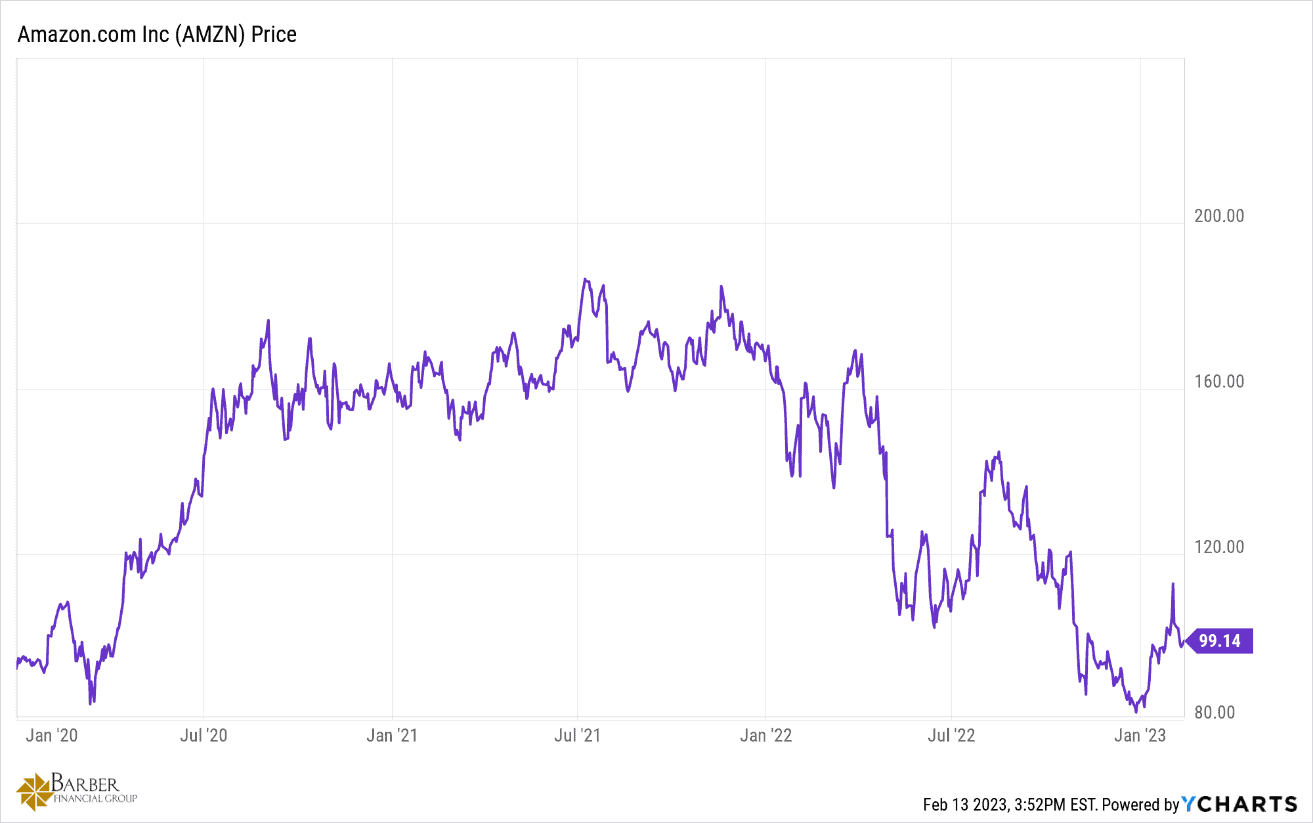
FIGURE 3 – Amazon Price – YCharts
Gaining Clarity and Confidence Through a Financial Plan
I hope you come away from this with a little more insight into why corporate earnings is such a key piece of data to keep an eye on. There are a bunch of other reasons as well, but we’ll cover those in another article. I don’t want you to have to digest that much information in one setting. Just know that we keep our eye on things like corporate earnings so that you don’t have to. That way you can focus on the things that matter in your life.
As you’re focusing on the things that matter in your life, it’s important that those things are incorporated into your financial plan. We frequently remind our clients that their financial plan serves as a permission slip to do all the things that matter to you throughout your retirement. A forward-looking financial plan encompasses your goals, accounts risk management, taxes, estate planning, investment management, and so much more so that you can have clarity and confidence about your financial life.
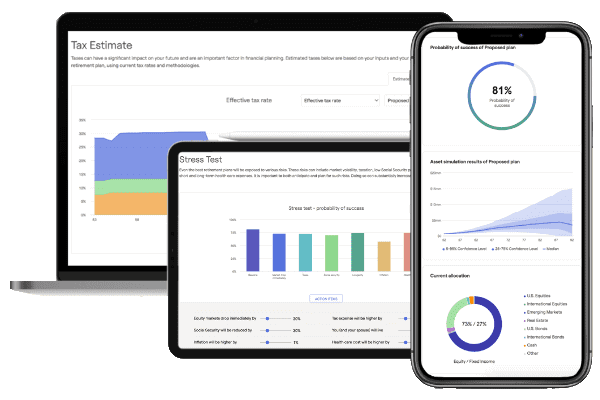
You can see how all those components come together to fit your unique situation by building your plan with our financial planning tool. This is the same tool that we use with our clients. We’re allowing you to access it at no cost or obligation and from the comfort of your home. Just click the “Start Planning” button below to begin building your financial plan today.
Ask Us Your Questions
There is so much that goes into explaining the importance of corporate earnings and financial planning. Modern Wealth Management clients can simply ask their questions about corporate earnings or anything related to their financial plan by connecting with their advisor. If you’re not a Modern Wealth Management client, we still welcome the opportunity to answer your questions as well. You can schedule a 20-minute “ask anything” session or complimentary consultation with one of our CFP® Professionals by clicking here. We can meet with you in person, by phone, or virtually depending on what’s most convenient for you.
Go CHIEFS!
Schedule a Complimentary Consultation
Click below to get started. We can meet in-person, by virtual meeting, or by phone. Then it’s just two simple steps to schedule a time for your Complimentary Consultation.
Investment advisory services offered through Modern Wealth Management, LLC, an SEC Registered Investment Adviser.
The views expressed represent the opinion of Modern Wealth Management an SEC Registered Investment Adviser. Information provided is for illustrative purposes only and does not constitute investment, tax, or legal advice. Modern Wealth Management does not accept any liability for the use of the information discussed. Consult with a qualified financial, legal, or tax professional prior to taking any action.