The Federal Reserve’s Monetary Policies
Key Points – The Federal Reserve’s Monetary Policies
- The Federal Reserve’s Three Core Monetary Policies
- Would a 0.5% Initial Rate Hike Have Been More Realistic?
- What Is Going on with the Federal Reserve’s Balance Sheet?
- What Can History Tell Us About Rising Interest Rate Environments?
- A Medical Analogy to Analyze Market Volatility
- 11 Minutes to Read
The Federal Reserve’s Three Core Monetary Policies
With all the market volatility we’ve seen in recent months, the amount of pressure on the Federal Reserve has continued to intensify with every move they make (or don’t make). The Federal Reserve finally made one of their highly speculated moves on Wednesday, March 16, when Chairman Jerome Powell announced a 0.25% increase of the Fed funds rate. It marks the first Fed funds rate hike in more than three years.
Even with that announcement and their tentative plan to have six more rate hikes in 2022, the number of questions for the Federal Reserve seems to be rising faster than their ability to give answers. As the Fed continues to walk a tight rope, it’s important to remember what the Federal Reserve’s monetary policies are.
LSA Portfolios President Brad Kasper shared his thoughts with us last week to help assess how the Federal Reserve is doing with their core monetary policies, which include protecting the value of the dollar, keeping employment in check, and keeping inflation in check.
Protecting the Value of the Dollar
Let’s start with looking at the value of the U.S. dollar. The value of the dollar continues to be strong, but Brad points out that the weaker status of other currencies may have something to do with that perception.
“That has especially been the case since the war has been going on with Russia and Ukraine,” Brad said. “I don’t know that the economy is strong enough to support six or seven rate hikes this year. It definitely seems strong enough to get us going here, but I’m a little bit concerned that the pace is going to keep up throughout the year.”
Keeping Employment in Check
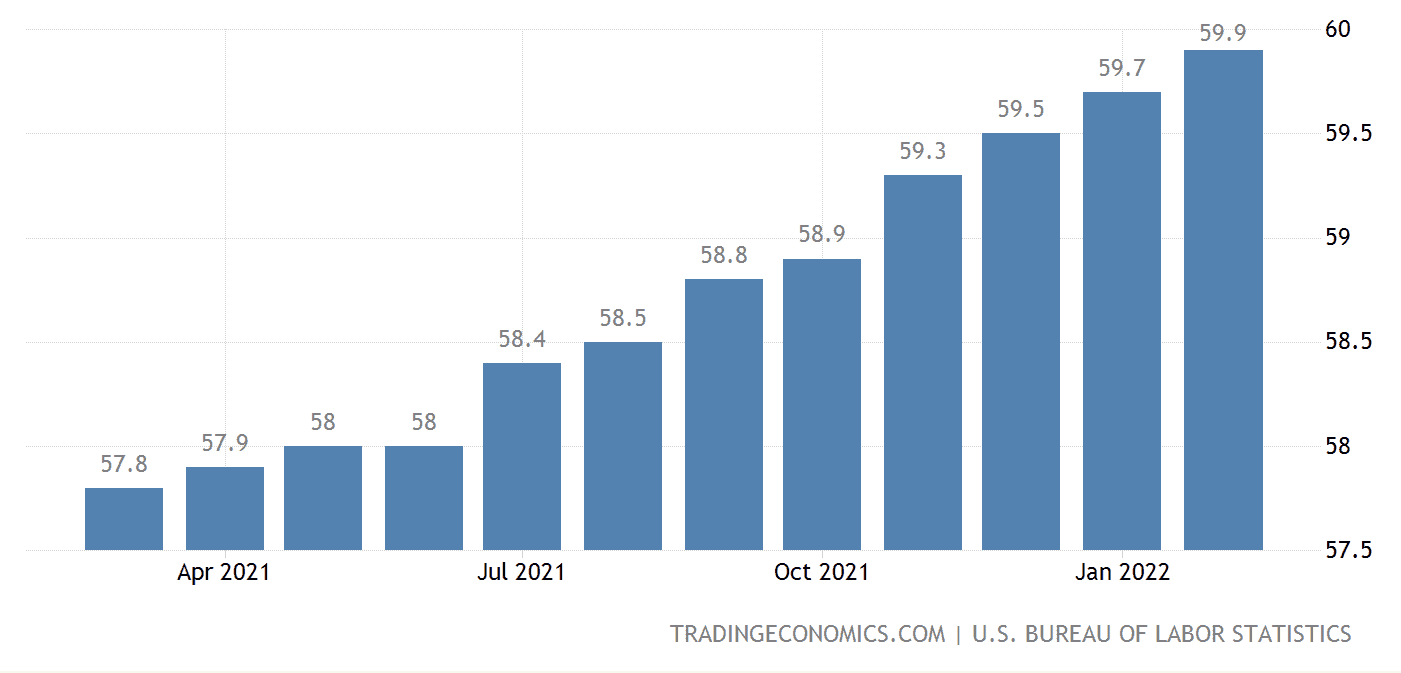
The Federal Reserve is also checking its monetary policies box when it comes to employment. As you can see in Figure 1, U.S. employment rate climbed again in February to 59.9%.

FIGURE 1 – U.S. Employment Rate – U.S. Bureau of Labor Statistics
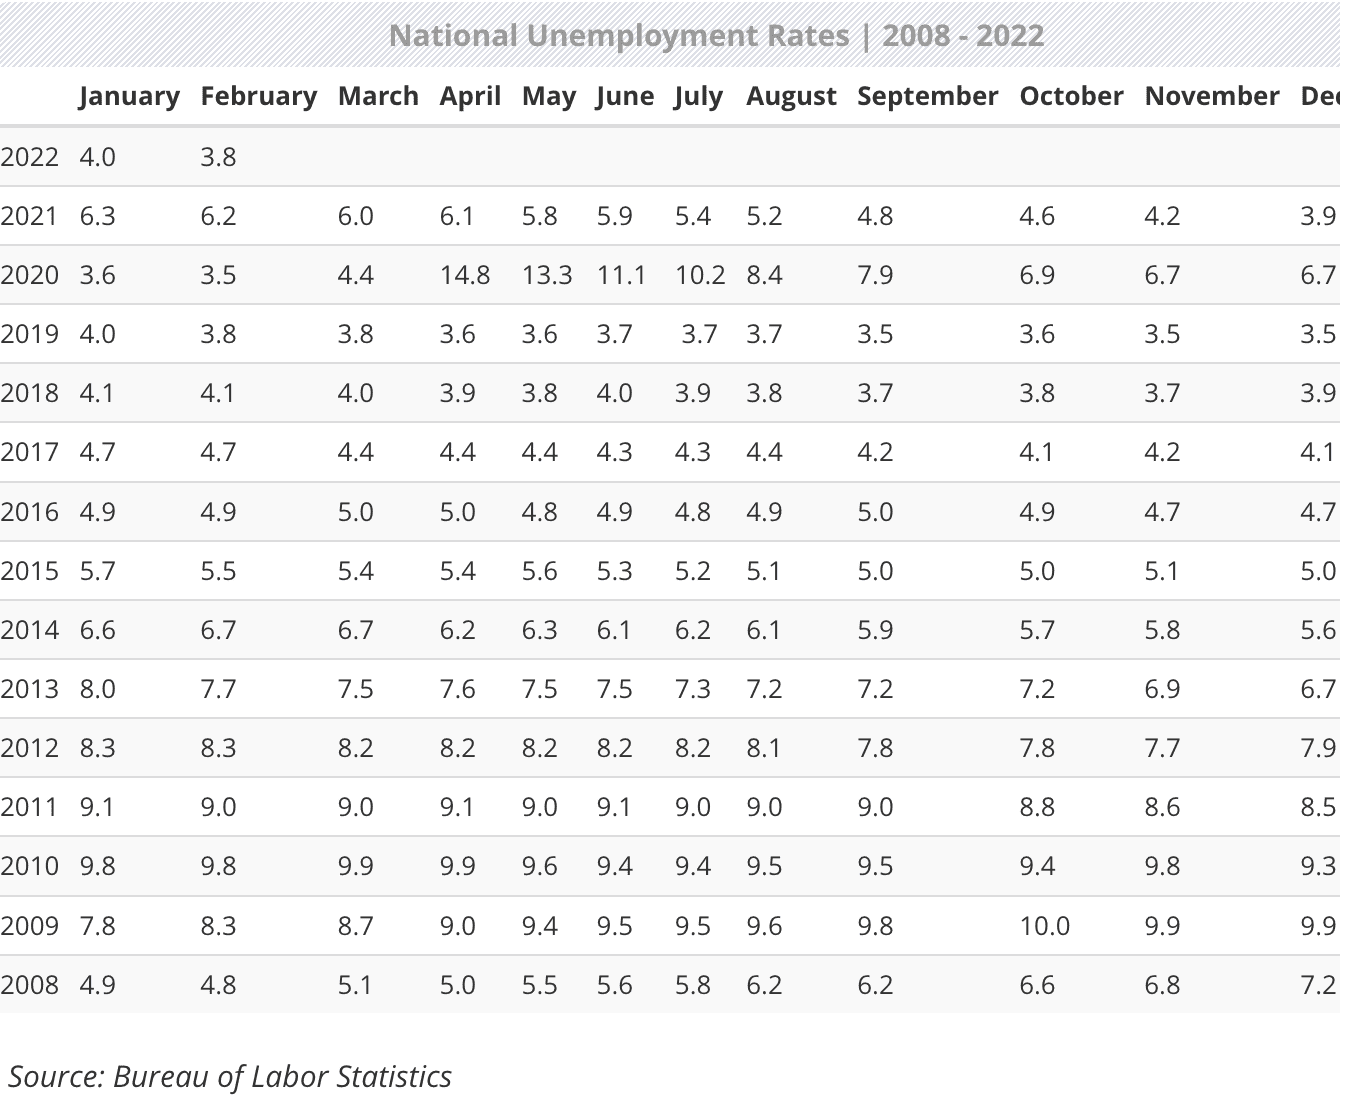
And as far as unemployment goes, Figure 2 shows that the U.S. unemployment rate is the lowest it’s been since February 2020.

FIGURE 2 – National Unemployment Rates 2008-2022 – U.S. Bureau of Labor Statistics
Keeping Inflation in Check
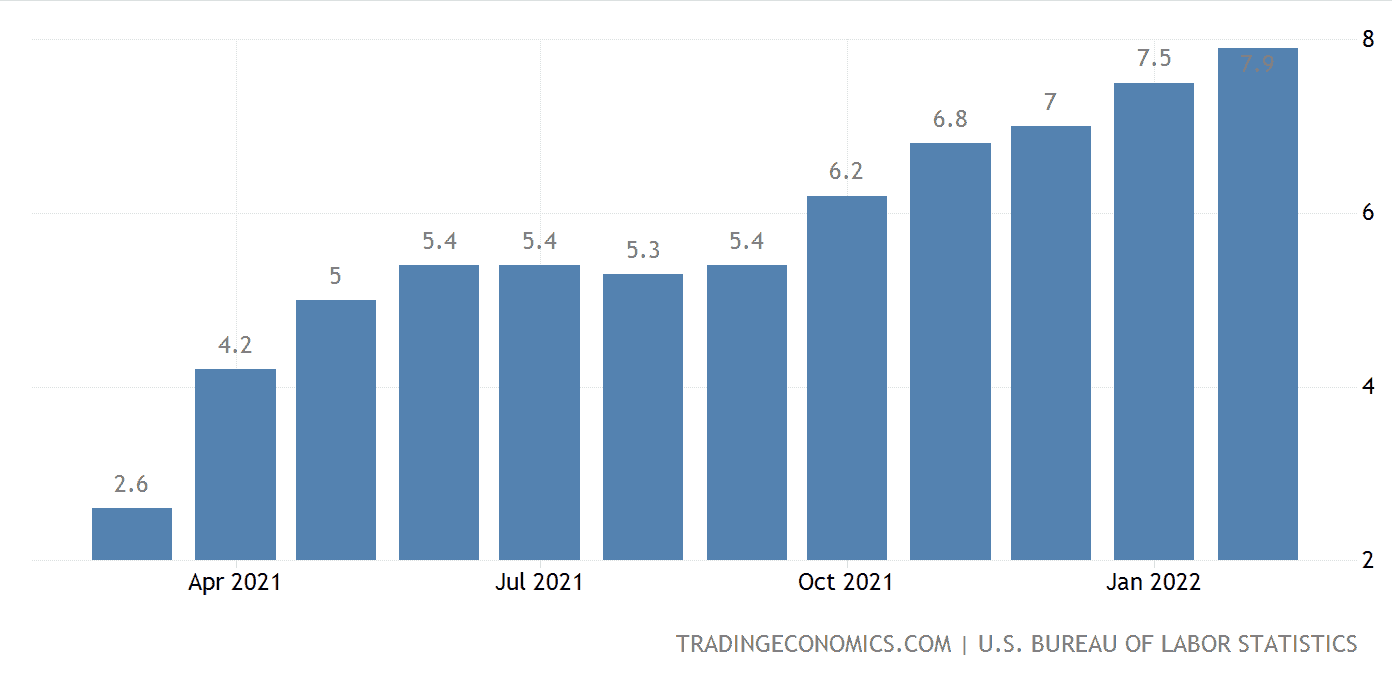
That brings us to the Federal Reserve’s last monetary policy gauge of keeping inflation in check. Well, we haven’t seen inflation like this in decades. Figure 3 outlines that year-over-year inflation hit 7.9% in February, which is its highest mark since January 1982.

FIGURE 3 – U.S. Inflation Rate – U.S. Bureau of Labor Statistics
“Inflation has been like watching paint dry over the last 10 years. We’re looking for some wage growth and wage inflation that suggests that there’s more of an inflationary environment versus stagflation,” Brad said. “The Federal Reserve now has one of their primary monetary policies that’s running away from them. They need to stay focused and raise rates before they get too far out of the game where they can’t make an impact.”
While Brad believes that the Fed is doing a good job of trying to stay ahead of things, inflationary pressures are clearly running hotter than usual. Should this sky-rocketing inflation continue, Brad is concerned that there could be a recession that is a lot deeper and probably longer in duration over time.
Brad and his LSA Portfolio colleagues stated in their 2022 outlook that they thought the Fed would implement four 0.25% rate hikes this year. Their 2022 outlook also forecasted for inflation to cool off during the summer or at least in the third quarter. However, there has obviously been a great deal of geopolitical uncertainty so far in 2022 that has cast some doubt on those projections. Brad believes there is still a chance for inflation to cool off by then, but the war between Russia and Ukraine brings a new inflationary challenge surrounding energy that the Fed is going to need to navigate.
Would a 0.5% Initial Rate Hike Have Been More Realistic?
Although a majority of the Federal Open Market Committee believed a 0.25% kickoff hike was the best decision to efficiently tighten the Federal Reserve’s monetary policy, it wasn’t unanimous. St. Louis Federal Reserve President James Bullard suggested an initial 0.5% increase. Still, there was the concern of giving the markets a clear enough signal ahead of the increases that was likely a huge factor in going with the 0.25% kickoff instead.
The Federal Reserve has been signaling March as the beginning of these rate hikes since last fall. Those signals have led to the volatility and turmoil in markets over the last couple of quarters.
What’s Going on with the Federal Reserve’s Balance Sheet?
LSA Portfolio’s 2022 outlook also assessed how the Federal Reserve was going to unwind its balance sheet. Powell shared in Wednesday’s announcement that unwinding the $9 trillion balance sheet would be a core component to the Federal Reserve’s strategy with their monetary policies.
Meanwhile, the Fed is becoming one of the biggest bond buyers in the marketplace. And the bond market continues to see pressure.
“When you get into a situation like 2020 and bond markets are starting to stall, you lose your buyers. Nobody is a net buyer in the game,” Brad said. “You become a net liquidator because with volatility and downside, people want to get rid of stuff. They start becoming net sellers.”
Brad points out that bond markets are only healthy if there is liquidity and buyers on the backside. The institutions started to slow down and dry up. Therefore, Brad didn’t like the Fed’s chances to unwind its balance sheet and control inflation throughout the course of the year, even before the war between Russia and Ukraine escalated.
“If the Fed unwinds the balance sheet too quickly and liquidity becomes an issue within the bond markets, it could have a tremendously negative impact on bond prices,” Brad said. “Again, the Federal Reserve is between a rock and a hard place. They know they need to unwind those balance sheets and get out of the game. But if they do it too quickly, they can create disruption.”
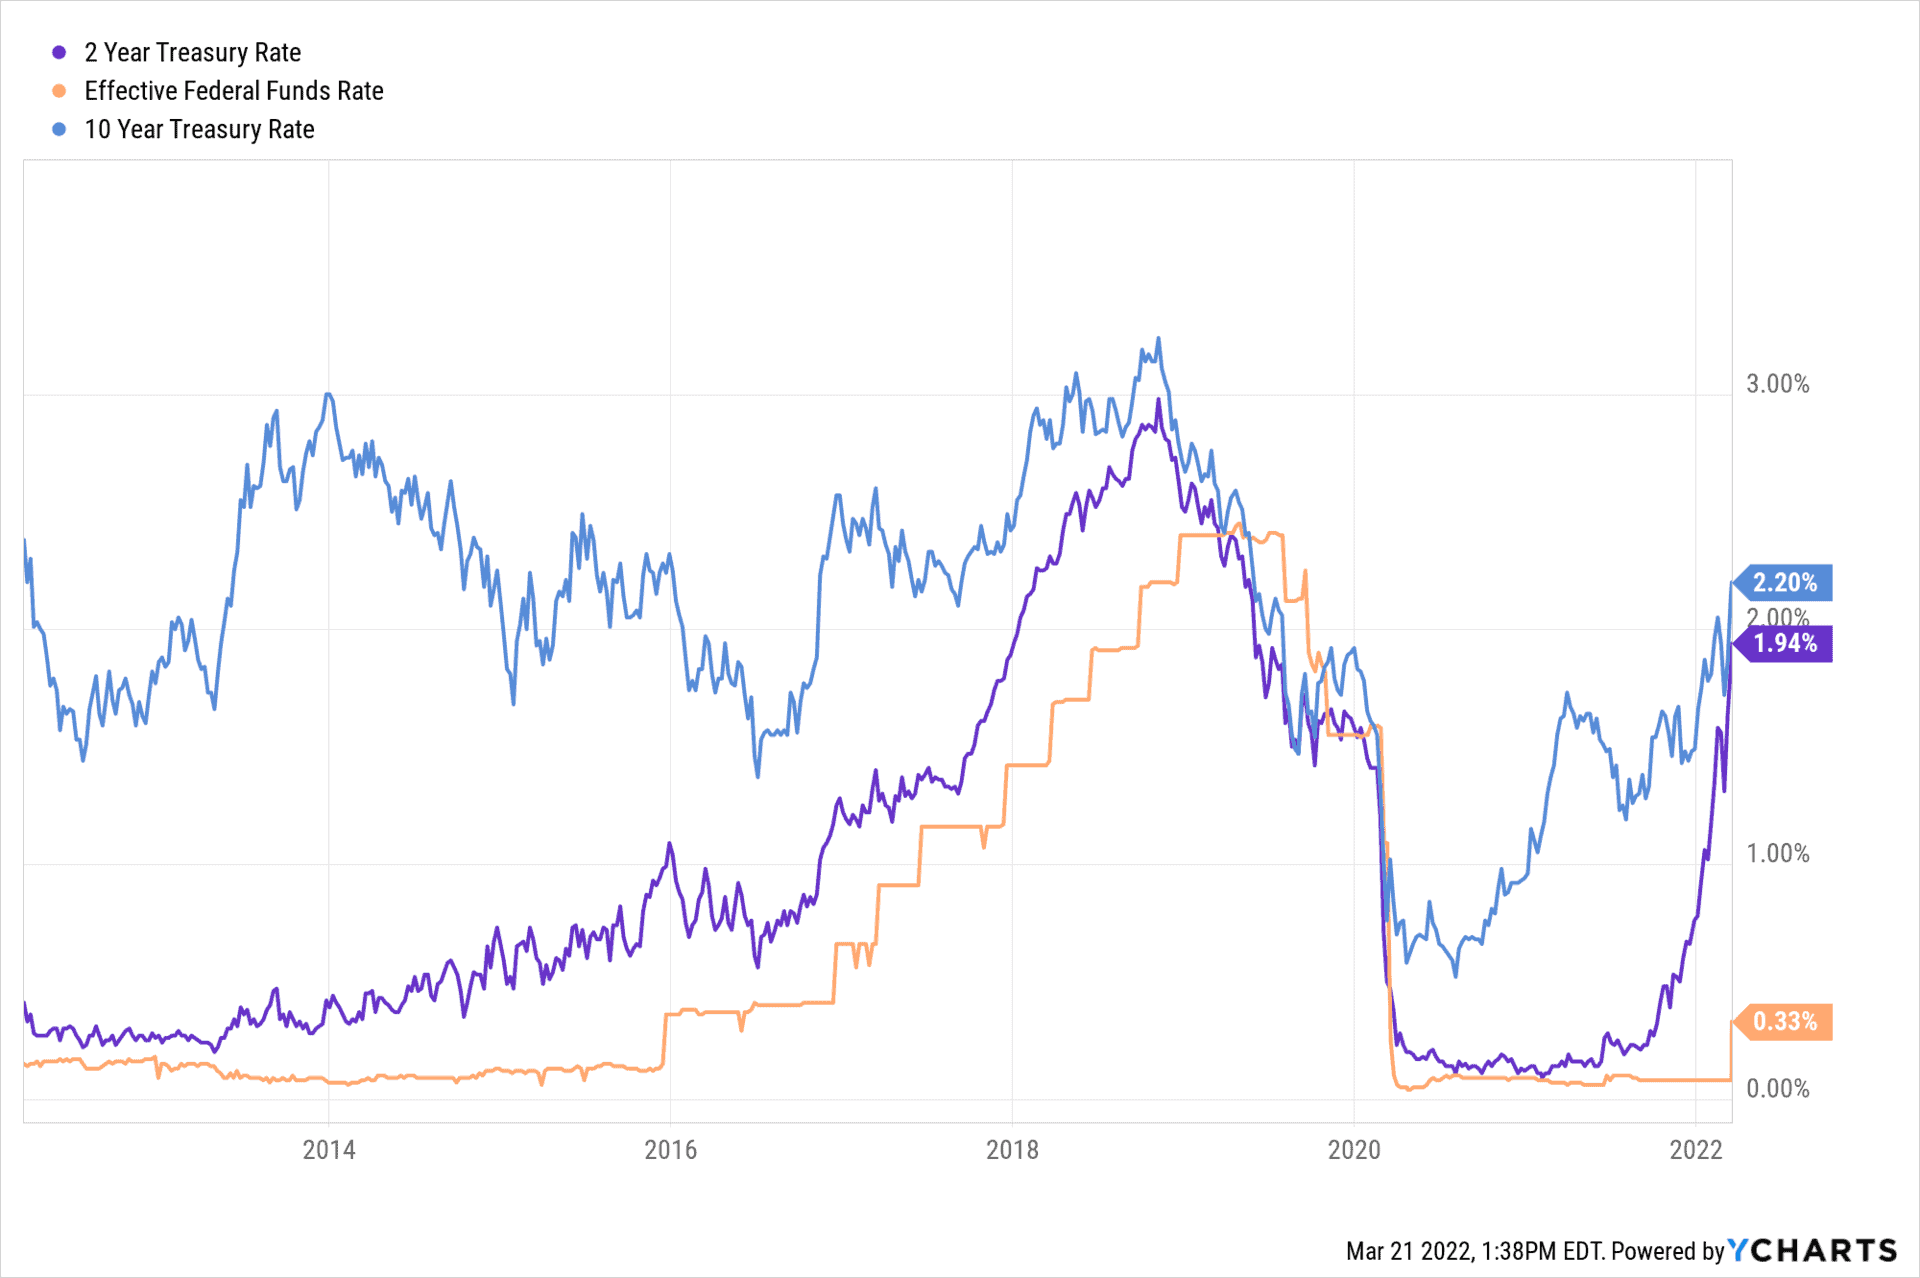
One of Brad’s favorite charts to look at regarding the Federal Reserve’s monetary policies compares the two-year treasury rates versus the Fed funds rate. You can see this below in Figure 4. It was a strong indicator that the Fed was going to raise rates in March.

FIGURE 4 – Two-year Treasury Rates Versus the Fed Funds Rate – YCharts
“There was a big spread being generated that suggested that the Fed had plenty of room and the markets kept pricing it in,” Brad said. “They needed to get on zero interest rate policy.”
A Couple of History Lessons
Let’s also look at recent rate hikes to get a better understanding of the Federal Reserve’s monetary policies. At the end of 2015, two-year treasuries started to blow out and the Fed started to normalize.
“We talk about normalizing a rising interest rate environment as if it’s something of a long time ago. But it really wasn’t,” Brad said. “Just look at 2015 through 2018 when the Fed was raising rates at a decent pace. Everybody is correlating that if the Fed raises rates too quickly, they’re going to drive us into recession. There’s truth in that because every recession is driven by higher rates to go borrow money. So, the Fed often gets pinched as one of the primary catalysts of every recession that’s ever played out.”
Over that timeframe, though, markets did well. Bonds did OK and equities did well, too. Historically, equities do well in a rising interest rate environment because the Fed isn’t going to make big decisions to move if it’s going to create tremendous amounts of volatility. However, Brad reminds us that we got a little bit over our skis in 2018.
“The Fed was raising rates a little bit too much and too fast,” Brad said. “At the tail end of 2018, there was a big equity sell off. There was a hold back on the spread in bonds. The two-year and five-year treasuries were actually going according to the yield curve. Twos and fives aren’t a big indicator of recession. Twos and 10-year treasuries—when the two-year inverts against the 10-year—becomes a little bit more complicated. That’s more of a historic indicator of recessionary pressures.”
Looking at This from Powell’s Perspective
Jerome Powell had to backtrack a little bit in 2019 and lowered rates throughout the year. Then, he backed into the global shutdown due to COVID-19 in 2020. They went to a zero interest rate policy overnight and started pumping $40 billion of bond buybacks into bonds to stave off what could have been a massive liquidity issue. That could’ve disrupted bonds a lot more dramatically than what played out in 2020.
“Part of that history lesson that Powell lived through in 2019 when they went too far too fast could be on his mind,” Brad said. “I think he wants to do a nice, slow, steady pace with raising rates. They’re trying to be as clear as they can be with what that looks like. And I have huge respect for that.”
In the past when there would be talk of raising rates, it was data dependent. Brad didn’t like that because goal posts were shifting from meeting to meeting and you never knew what data they were looking at, how it was playing out, and what decisions they were making.
“The markets didn’t really like the uncertainty when that happened,” Brad said. “I wish Powell would have started raising rates at the tail end of last year. The spread on the two-year treasuries and the overnight lending rate gave him to do so.”
Defining New and Old Economic Factors
While there is a lot we can learn from history, it’s important to not draw too many parallels from the history of economic trends. For example, think about how the 1980s and 1990s were a period of incredibly solid U.S. economic growth. That period included the technology boom, so there was a ton of growth that was naturally taking place.
Most societies have these over cycles with pockets of huge expansion and then it starts to slow up again. We saw that in the last decade of the 2000s and into the 2010s. But now, let’s look at where we’re at today.
“I’m not sure we have the same dynamics from the economy to combat inflation, though,” Brad said. “Back then, Alan Greenspan was unapologetic for stifling growth or driving recession to make sure that they were keeping monetary policy in check.”
The other thing that Brad thinks is very different from back in the 1980s is that Greenspan never utilized tools like bond buyback programs. Nobody really did until 2008-2009 when the Fed originally rolled out with Troubled Asset Relief Program Information (TARP) and Term Auction Facility (TAF). Both programs flooded the bond markets with capital to try to keep us out of the complete financial crisis breakdown.
“History will tell us 30-40 years from now whether that was a good or bad idea. When they originally created that playbook, it was as if they were mid-flight and trying to figure out how they were going to land the plane,” Brad said. “Sure enough, they kind of pulled us out of it. It’s too early to tell, though, whether it would be a good thing to flood the market with that kind of capital again.”
But Remember, History Doesn’t Always Repeat Itself, But It Often Rhymes…
In 2020, the Federal Reserve took the same monetary policies 2008 playbook and put it on steroids. In one month, the Fed was suddenly packing as much money as they were doing in the entirety of what the original TARP and TAF packages were doing. Those were all tools that the Fed started to utilize way past that 1980 kind of playbook. However…
“I’m not sure that this inflationary cycle looks the same. The saying goes that history doesn’t always repeat itself, but it rhymes a lot,” Brad said. “There’ll be some things that rhyme, but I don’t think that is a complete repeat of what the Federal Reserve utilized as monetary policies in the 1980s to stave off inflation versus what they’re going to need to combat over the next couple of years.”
What Can We Learn from Other Countries’ Economic Activity?
Along with deciphering how much we should use history as a gauge of economic activity, we can also look at what has and hasn’t worked well in other countries. Think of Japan and how they flooded their markets for decades. They were doing all this to kind of keep themselves out of recession and they just completely stifled growth.
“Now, in all fairness, like I mentioned with the U.S., Japan had just come out of their massive expansionary period as well,” Brad said. “And they were starting to stall a bit. If we were to see economic activity stall, I think the tools become less and less effective by pumping money into the system. What I’m fearful of being in the situation that Japan was in when they found themselves stuck in stagflation. It didn’t really matter how much money they had pumped in there because it did not have the same impact that it once did in the early days.”
A Medical Analogy to Analyze Market Volatility
Brad likes to use a medical analogy for this type of situation. Let’s say someone has pain and their doctor gives them a cortisone shot to provide the patient some relief. That might be effective for a while, but if the patient keeps taking that same shot in the same spot week after week or month after month, eventually the effectiveness is going to wear off. The body becomes immune to it.
“It’s the same thing with economies, right?” Brad said. “We can pump money into the system and create a very quick impact. But the more that we do it, the less of an impact that it has. Right now, I think we find ourselves in a conundrum. How do we fight this next round of volatility and trouble markets? I don’t know that the same tools are going to be as effective as they were in 2008 or 2020.”
The Main Takeaway
Although this market volatility that we’re experiencing between liftoff and getting to a reasonable level can feel very stressful, it’s critical to remember that normalizing the raising of rates is not a bad thing long term. Here’s one more hypothetical from Brad to help put things in perspective.
“The idea is that 10-year treasuries are around 3% or even the historical average of 4.2% to 4.5%. That’s very powerful for retirees that are looking at their income,” Brad said. “Now, I can get a bond that’s paying me for 5%. That’s good income to offset the income needs that they have in retirement. It’s good income to just provide some greater growth over time.”
Brad added, “The problem is for the 10-year to go from 2% that it’s at today to 4%, you’re talking about close to 20% disruption on prices. It’s about every 1% movement of that 10-year treasury, you’d have about a 10% correction in bond prices. That’s real rough math, but hopefully you get the gist of that. Getting to 4% can be fantastic for investors long term. Getting there, though, is where a lot of the pain is at.”
If the Fed unwinds too quickly and dries up liquidity, the idea of that 10-year getting to a more normalized level is going to be challenging. It’s going to be interesting to see how they do it. They’ve done it before with TARP and TAF. But again, those were blips on the radar versus what they just did with the bond-buying program after the global shutdown following the onset of COVID.
The Importance of a Fluid Financial Plan
As you can see in some of Brad’s final points, there is a lot of number crunching to do as the Federal Reserve reviews its monetary policies. Even if you are someone who enjoys doing that number crunching, that pain that Brad mentioned with trying to get to that 4% still likely won’t feel good.
That’s where a CERTIFIED FINANCIAL PLANNER™ Professional can help with providing clarity and confidence amid all the number crunching. There could be some recessionary pressures that come out of all this, but on the backside of that, these are healthy cycles for the markets to go through. Remember that the income you need five to 10 years from now serves an entirely different purpose than your income today.
“If you think about just the vast amount of baby boomers that are now in retirement and needing income, it could take us five to 10 years, but as you get there, their income profile should be more favorable to investors that are seeking income down the road,” Brad said. “We just need to be cautious and aware of the decisions that we make between now and then.”
If you have any questions about the Federal Reserve’s current monetary policies and how they relate to you on a personal level, you can schedule a complimentary consultation or 20-minute ask anything session with one of our CERTIFIED FINANCIAL PLANNER™ professionals. We can meet with you in person, virtually, or by phone.
Schedule Complimentary Consultation
Select the office you would like to meet with. We can meet in person, by virtual meeting, or by phone. Then it’s just two simple steps to schedule a time for your Complimentary Consultation.
Lenexa Office Lee’s Summit Office North Kansas City Office
Investment advisory services offered through Modern Wealth Management, Inc., an SEC Registered Investment Adviser.
The views expressed represent the opinion of Modern Wealth Management an SEC Registered Investment Advisor. Information provided is for illustrative purposes only and does not constitute investment, tax, or legal advice. Modern Wealth Management does not accept any liability for the use of the information discussed. Consult with a qualified financial, legal, or tax professional prior to taking any action.