How the Phillips Curve Became Flat
Key Points – Lost Decade of the 1970s and Why It Still Matters
- The History of the Phillips Curve
- How Are Wage Inflation and Unemployment Correlated?
- Why the Phillips Curve Needs to Be Something of the Past
- There Are Several Things That Impact Inflation That Aren’t Accounted for
- Looking for Ways to Accurately Measure Inflationary Pressures
- 13 Minutes to Read
The Namesake of the Phillips Curve: A.W. “Bill” Housego Phillips
Alban William Housego Phillips, more commonly known as A.W. or Bill, was born in New Zealand on November 18, 1914. According to his Wikipedia page, he briefly lived and worked in Australia before moving to China in 1937. That move was ill timed, though. In that same year, Japan invaded China, which forced him to escape into Russia. He eventually rode the Trans-Siberian Railway into the United Kingdom in 1938.
While in the United Kingdom, he studied electrical engineering until the outbreak of World War II. At that point, Phillips joined the Royal Air Force. He was eventually captured by the Japanese and spent three and a half years in a prisoner of war camp in the Dutch East Indies.
After the war, while studying sociology at the London School of Economics, he developed an interest in Keynesian Economic Theory and switched his course of study to economics. By 1958, he became a professor of economics at his alma mater.
Understanding the Phillips Curve
That same year, he published, The Relation Between Unemployment and the Rate of Change of Money Wage Rates in the United Kingdom, 1861–1957†. It detailed the research which established what became known as “the Phillips Curve.” His study of the historical data on the relationship of wage inflation to unemployment rates in the UK suggested that there was a stable and an inverse relationship between the two from 1861 to 1957. Figure 1, below, is his published study that I just mentioned, and it makes a fairly compelling argument.
FIGURE 1 – The Phillips Curve – Wiley Online Library
How the Phillips Curve Shaped Monetary Policy
However, if you look closely at the raw data for several of the time frames that he used to complete the Phillips Curve, you’ll see that there was a fair amount of what I’ll call “data wrangling” to get the data to fit the theoretical curve.
What the data appeared to suggest was that you could have low unemployment or low wage inflation, but you couldn’t have both. There was only a tradeoff, as there was a stable and inverse relationship between unemployment and (wage) inflation. The evidence was that he was correct, and the Phillips Curve would help shape monetary policy for the next two decades.
Wage Inflation vs. Price Inflation
It didn’t take long for other economists to conflate Phillips’ wage inflation with price inflation, which most of us know are two separate things. Wages can, and do, increase without causing price inflation. And there can be high unemployment and high inflation concurrently.
Price inflation is caused by a whole host of other forces acting in the markets other than simply by wage inflation. Mind you, rising wages CAN cause inflationary pressure. They’re just not the only driver of price inflation. I believe this conflation of wage inflation with price inflation that was the eventual demise of the validity of the Phillips Curve, which today has fallen out of favor for all but the most dedicated devotees of Phillips’ work.
What Happened to the Phillips Curve?
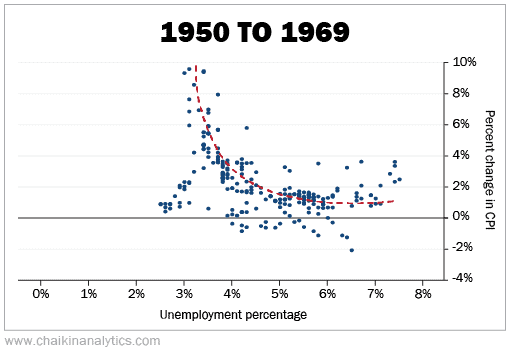
Figures 2 and 3 from Chaikin Analytics were assembled using data from FRED, the St. Louis Federal Reserve, which contains a wealth of economic data. Figure 2 consists of data from 1950 to 1969 that generally supports the Phillips Curve concept.
On the flip side, Figure 3 consists of data from 2000 to 2019 that shows that the theoretical relationship discovered in Phillips’ work has all but vanished.
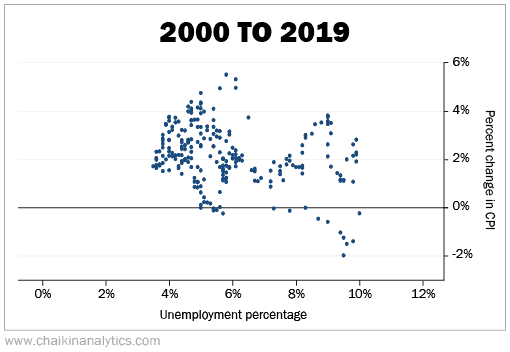
If you could find a trend in the dots on this chart, it would be a flat line. Only a magician…or a dishonest mathematician…but I repeat myself…could fit the 2000s data into a curve. The last 20 years have been characterized by relatively low unemployment and relatively low inflation. Something that wasn’t supposed to be possible based on the Phillips Curve.
So, what happened? How could the relationship so clearly evident in the 1950s and 1960s fall apart so completely? It’s a good question and one that doesn’t have a single answer. Instead, there are multiple answers and some theories to boot.
Did the Fed Kill the Phillips Curve?
In 2022, David Ratner and Jae Sim of the Federal Reserve Board in Washington, D.C., published a report entitled, Who Killed the Phillips Curve? A Murder Mystery. The title of the paper was inspired by James Bullard’s response to question from NPR’s John Ydstie in October 2018.
John Ydstie: “But these days, jobs are very plentiful, yet inflation remains very low. That’s got some people writing the obituary for the Phillips Curve.”
James Bullard: “If you put it in a murder mystery framework – “Who Killed the Phillips Curve?”– it was the Fed that killed the Phillips Curve.”
Looking Back at the Collapse of Labor Unions in the 1980s
However, their conclusion was not that the Fed had killed the Phillips Curve, but rather the collapse of Labor Unions that began in the early 1980s when President Reagan fired 11,000 PATCO Air Traffic Control workers who went on strike.
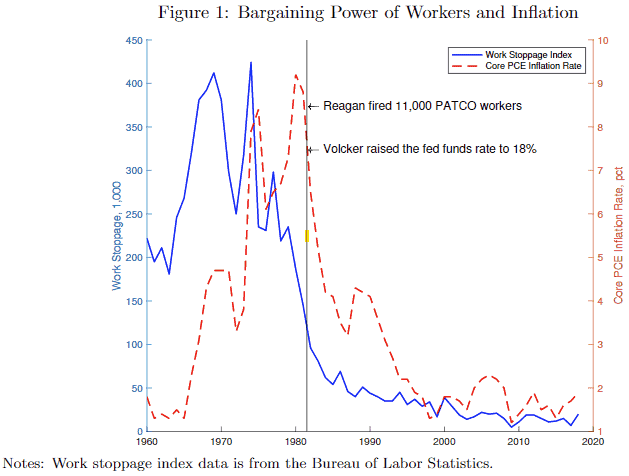
FIGURE 4 – Bargaining Power of Workers and Inflation – Bureau of Labor Statistics
That strike was in violation of a 1955 law that banned government employees from striking. One of the strikers from Cleveland Center, who had been with the FAA for 13 years, shared his thoughts in the comments on a 2021 story about the 40-year anniversary of the PATCO strike.
“I was a striker in 1981 fired from Cleveland Center after 13 years. It turned out to be a terrible thing, bad for me, the country, and the labor movement. I don’t think it was well thought out by anyone and particularly those who manned the picket lines. I think most went from high school to the military to the FAA and had a very limited world view which severely underestimated public opinion which was overwhelmingly against us.”
Clearly, Ratner and Sim are on the Keynesian team, just like Phillips was. Ratner and Sim believe wage inflation that resulted from bargaining agreements was responsible for inflation as a whole. They concluded that the absence of the ability of workers, broadly, to bargain with their employers was responsible for the lower rates of inflation that took hold in the mid 1980s.
The Root of Inflation Isn’t So Simplistic
I’m not throwing rocks at them. They did a lot of hard work in putting that paper together. And I appreciate that there are different opinions about what causes inflation and why. I simply think that some of the theories surrounding the subject are too simplistic in their approach and fail to consider factors that have a real and meaningful effect where inflation is concerned. I’m not alone in that belief.
Daniel K. Tarullo, who is a Nomura Professor of International Financial Regulatory Practice at Harvard and a former Federal Reserve Board of Reserve Board of Governors Member, had this to say about the failure of the Phillips Curve (and other concepts) as tools for monetary policy:
“The substantive point is that we do not, at present, have a theory of inflation dynamics that works sufficiently well to be of use for the business of real-time monetary policymaking. The sociological point is that many (though certainly not all) good monetary policymakers who were formally trained as such have an almost instinctual attachment to some of those problematic concepts and hard-to-estimate variables.”
Ratner and Sim stated in their report that:
“Governor Tarullo’s quote suggests that monetary policy will face substantial challenges if the root causes of the demise of the Phillips curve are not better understood, or new models of inflation dynamics are not developed.”
Too Many Dollars Chasing Too Few Goods
Other economists think the answer to what causes inflation is quite clear. It’s the Federal Government and their propensity to print money. Lots and lots of money. Milton Friedman produced a short video in 1980 that discusses this very thing. It’s worth a watch if you have the time. Additionally, the Fraser Institute produced a short three-minute animation laying out Friedman’s theory of money and prices.
For those of you who didn’t or don’t want to watch the video, his basic premise is that as you increase the supply of money in the economy, while leaving the supply of goods and services at the same level, the prices of those goods and services will necessarily increase by the amount of the additional money you put into the economy, over time. We refer to it as too many dollars chasing too few goods.
We just lived through a prime and historical example of what that looks like. The lessons learned (hopefully) will be taught in economics and monetary policy classes for the next 100 years. Sadly, the lessons are warnings about how not to handle a pandemic mixed with a severe supply chain crisis, because we failed in EPIC fashion, globally.
A Money Supply Chain Reaction
Figure 5 illustrates what happens when you dramatically increase the money supply to try and support the economy when the economy is producing far too few goods and service due to restrictions in activity and a broken supply chain that’s failing due to the restriction I just mentioned, as well as poor decision making at the highest levels of government and corporate management. This chart is pretty busy, but I want you to follow me on this.
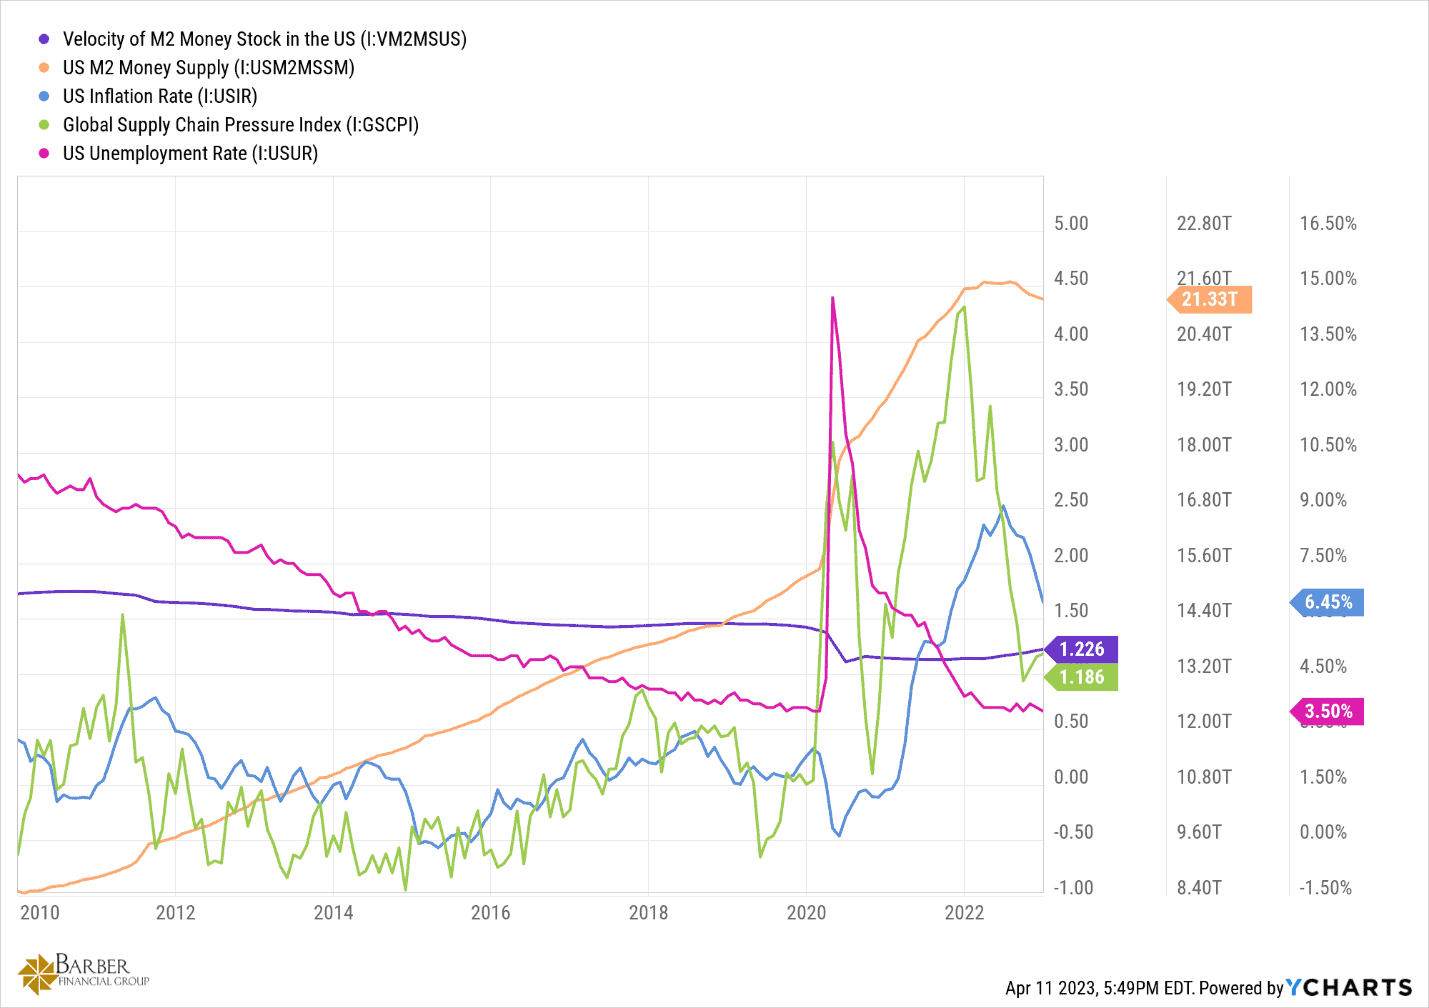
FIGURE 5 – Substantially Increasing Money Supply to Support the Economy – YCharts
I want you to see how these things all play out together in Figure 5. Look at the orange line and the green line. The orange line is the money supply, and the green line is the Global Supply Chain Pressure Index (GSCPI). Note that the money supply suddenly jumps beginning in early 2020. By the beginning of 2022, it increased by nearly $7 TRILLION. Now look at the GSCPI, the green line. Early in 2020, it jumped from zero to up to three, briefly falls back almost to zero and then rockets up to almost 4.5. A 450% increase.
Price Inflation Wasn’t Caused by Wage Inflation
Now look at the blue line. Inflation. After a brief lag, inflation begins to accelerate in mid-2020. Inflation was off to the races in 2021, peaking at 9.1% in June 2022. There is no question what caused the inflation that we just lived through. None. As supply chain pressures have abated and the Federal Reserve began removing the excess money in the system, inflation began to fall. It’s now at 5% year over year as of the latest inflation report.
The only people who still wonder what caused that inflationary event are those who are willfully blind, uninformed, or worse… But the inflation was NOT caused by wage inflation. It was caused by what I said earlier. Too many dollars chasing too few goods and services. Period. And note to all the neigh sayers, (knock on wood) the inflationary pressures of the last couple of years WERE transitory. The Fed raising interest rates was helpful in slowing inflation for sure. But the correlation between the GSCPI dropping and inflation falling is absolutely not a coincidence.
Could Deflation or Disinflation Be in the Forecast?
For proof of what I’m saying, check out Figure 6. Again, a little busy, but focus on the light blue line and the green line first. Inflation (blue line) followed the green line (GSCPI) up, with a little lag, basically mirroring it. And it has followed it down, again with a lag, but also mirroring it. Look how far the GSCPI has fallen. What if the inflation line falls that far? My friends, that’s the last thing anyone expects. But it’s possible. It’s actually called deflation, or at the very least disinflation. I bet you’re not going to hear that on your local news channel.
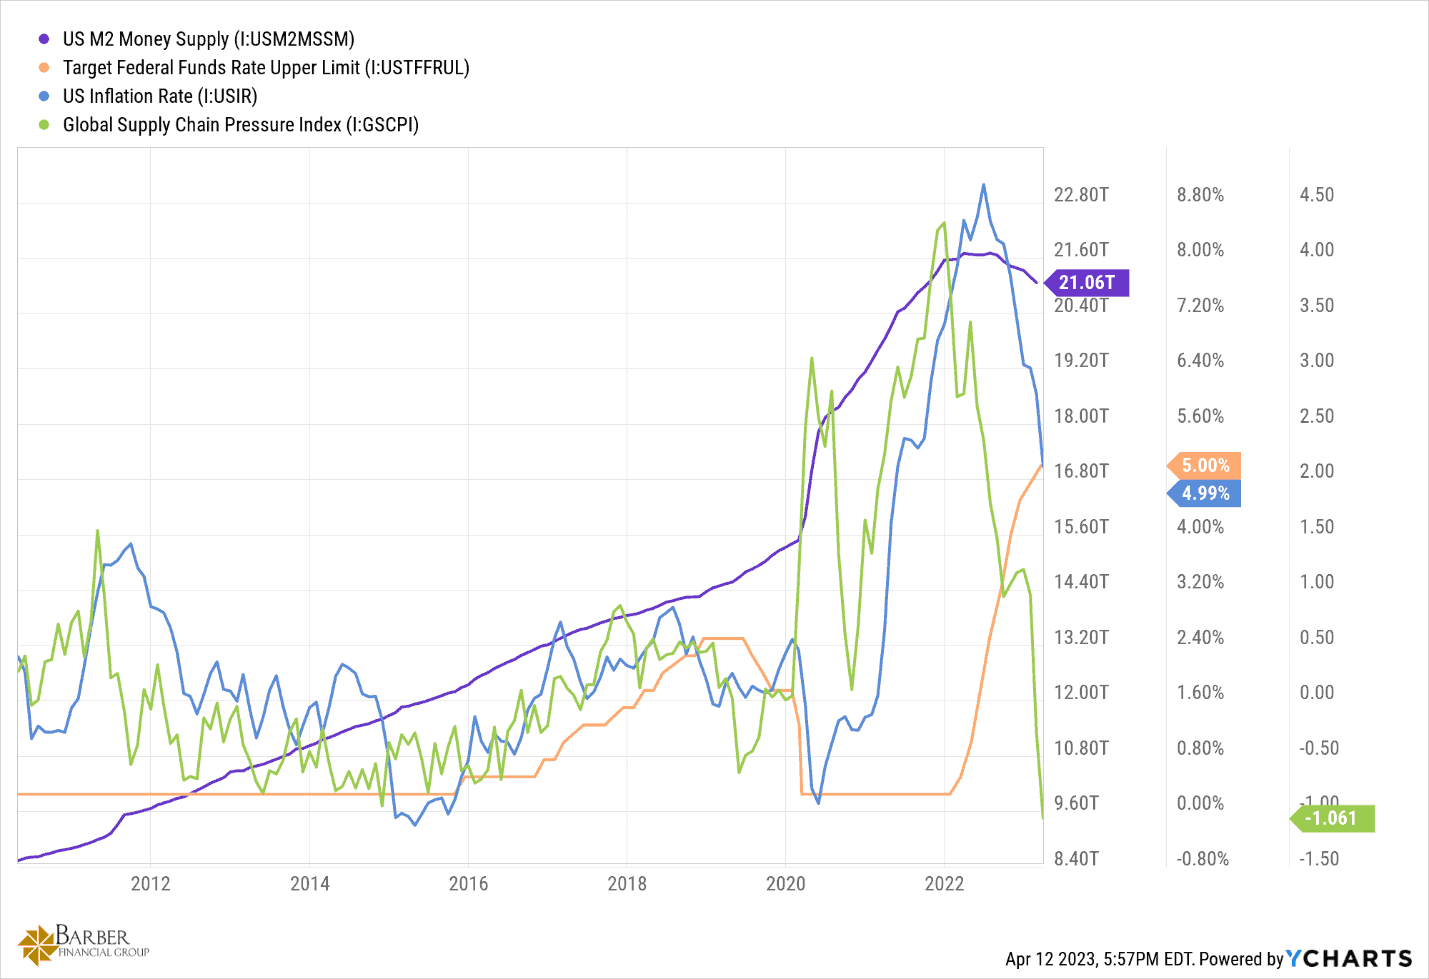
FIGURE 6 – Global Supply Chain Pressure Index Takes a Nosedive – YCharts
Remember what Paul Volcker said about inflation and the Fed funds rate that I noted in my article about the lost decade of the 1970s a few weeks back. He believed that to get inflation under control, you needed to have the Fed funds rate above the rate of inflation. Look at the blue line and the orange line on the far-right side of Figure 6. We are officially above the current inflation number with the Fed funds rate. And the purple line up there shows that the money supply is shrinking.
What that means is that anytime now, maybe next month or maybe June, Jerome Powell is going to hold a press conference and announce that they have beaten inflation, and that further interest rate hikes will not be forthcoming.
And if inflation continues to fall as fast as the supply chain pressure index, we’ll hit the Fed’s target of a 2% inflation rate by September if not before. There’s a possibility we might blow right through that number and could potentially see deflation in some form or fashion. I know, I know, no one is saying that right now. But the trend is in place…firmly.
Overlooked Components That Impact Inflation
That brings me back to all the things that affect inflation in the economy that so many fail to account for in their inflation outlook and policy responses. These are simple things that get ignored or glossed over for whatever reason, at the reputational peril of those who do so. Here’s a short list of the things I think are important but overlooked.
1. The Supply Chain
As I discussed in an article a while back talking about supply chain issues, we live in a “just in time” world, where the smallest crack in the supply chain that makes sure the products needed to produce everything from phones to washers to cars, can cause a huge backlog in availability. The resulting shortages cause the prices of those items to rise, artificially and quickly, until the supply chain issue is fixed.
The world relies on the timely and efficient transportation of raw materials and sub-assemblies, delivered to their point of use, on time, to function properly today. It’s a delicate balance, and a dangerous tightrope walk even the Flying Wallendas would think twice about.
2. Production Efficiency and Technological Innovation
Ever notice how the price of televisions these days doesn’t go up, just the size of the television you’re able to buy for the same amount of money? The first “big screen” I bought was in the early 1990s. It was a 37-inch screen, weighed 150 pounds, and cost me $1,300. Today, you can buy a 75-inch television that weighs less than half as much, with an infinitely better picture, for less than $600. That’s an example of production efficiency and technological innovation.
3. Demographics
Most of you know that I’m a student of demographic trends. The reason I am is because of what you can learn about what is likely to happen in the economy over the next several years, based on the breakdown of the population by age groups, understanding how many people are in each group, and what people in those age groups tend to do/buy in that stage of their lives. It’s an incredibly predictive tool used by everyone…everyone except those trying to predict inflation apparently.
4. Money Supply and Money Velocity
As we’ve seen, money supply can affect inflation in a very real way. Tight money and high interest rates will constrain economic growth/activity. Loose money and low interest rates will spark the same. Failure to acknowledge these two basic economic facts in your attempt to predict and/or mediate/encourage inflation is a fool’s errand. Much like leaning on the Phillips Curve to make monetary policy decisions has become
Money velocity is especially ignored by far too many people. When/if the velocity of money (the number of times a dollar changes hands in a given period of time) increases to recent historical levels before the Fed gets all the excess money out of the economy…everything I’ve said to this point will be wrong, and rampant inflation will ensue, making the 1970s look like a cake walk.
5. Global vs. Local
Like it or not, we live in an economy that’s no longer just based on what happens in the United States. Actors/events outside our borders and out of our control can and do have an effect on the prices we pay for certain goods and services. Sometimes that’s a good thing, others not so much. But to ignore the potential impact of that reality is to limit your ability to be accurate in your predictions/prescriptions where inflation is concerned.
6. Myopic Economic Theory Adherence
If you are a Keynesian economic purist, you will dismiss out of hand the thought that anything other than wage inflation can cause actual price inflation. If you’re more attuned to Milton Friedman’s philosophies, you’ll blame the Federal Reserve and its money printing for every case of inflation you see.
The reality is that there are nuggets of truth in both philosophies, and one must take a much more comprehensive look at the situation at hand to make a reasonable determination as to the cause of the current inflationary/deflationary trend. Failing to do so may result in a little egg on the face.
Look, the reality is that I’m just a guy who grew up in what some would call the middle of nowhere, and I have no Harvard, Yale, or Stanford degree in anything. But I know economics better than most who have degrees from the aforementioned universities. I got that knowledge from seeing the economy from the inside for almost 20 years, not looking at it through a “higher education” lens, taught by people who likely have never, and likely will never, produce anything in the real economy.
We’ve talked about a lot of things here. And I’m willing to admit that I may well be wrong in my assessment. I’m OK with that. I’m just telling you what I see.
How Will Inflationary Pressures Be Predicted in the Future?
I do believe that the Phillips Curve has seen its better days and will soon be relegated to the ash heap of historical economic theories that didn’t hold up…where it belongs…though I have no ill will for its creator. On the contrary. I think Bill Phillips was an incredible man, who lived an incredible life. He deserves the respect that all war heroes have earned. I would have loved to have met him. Unfortunately, he passed in 1975 when I was 11. So, if I had met him, the conversation would have been something less than productive.
I feel bad that his theory has been shown not to hold up to modern scrutiny, but I hope this discussion will help move the needle forward in identifying a way to accurately model and predict inflationary pressures in the future. Much work is yet to be done, and many theories (mine included) may fall in the pursuit of that goal. As it must be.
The Power of Forward-Looking Financial Planning
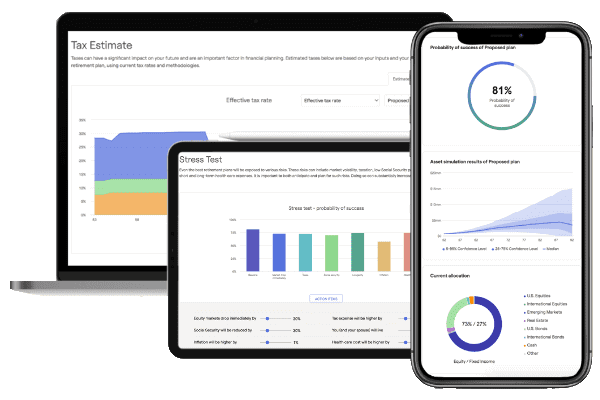
I only hope to be correct in the short term, and that our recent bout with inflation will be nothing but a bad memory 12 months from now. We’re always learning from history as best as we can to make educated financial decisions when planning for the future. We do it all the time when we’re stress testing people’s financial plans.
There have been many times where people have come to us with what they think is an ideal financial plan, but they haven’t put any pressure on it with proper inflation rates. The past year and a half has shown that applying a 1% or even a 2% inflation rate to your plan can be very problematic. And you need to apply an even higher inflation rate to things like health care costs.
You can see what this looks like for you by using our industry-leading financial planning tool. We’re giving you the opportunity to use our tool from the comfort of your own home and at no cost or obligation. Just click the “Start Planning” button below to begin building a plan that can give you the clarity and confidence that you need going forward.
Starting a Conversation with a CFP® Professional
Whether it’s learning more about how the Phillips Curve became flat, further discussing the relationship between wage inflation and unemployment, or figuring out how you can live your one best financial life, it all starts with working with a CFP® Professional and building a financial plan. You can schedule a meeting with one of our CFP® Professionals by clicking here. We can meet with you for a 20-minute “ask anything” session or a complimentary consultation. The meeting can be in person, over the phone, or virtually—it’s whatever works best for you.
Investment advisory services offered through Modern Wealth Management, LLC, an SEC Registered Investment Adviser.
The views expressed represent the opinion of Modern Wealth Management, LLC, an SEC Registered Investment Adviser. Information provided is for illustrative purposes only and does not constitute investment, tax, or legal advice. Modern Wealth Management, LLC does not accept any liability for the use of the information discussed. Consult with a qualified financial, legal, or tax professional prior to taking any action.