When a Housing Market Shortage Becomes a Surplus
Key Points – When a Housing Market Shortage Becomes a Surplus
- The Impacts of Pandemic Policy, Inflation, and Rising Interest Rates on the Housing Market
- How Does This Housing Market Bubble Compare to Past Housing Market Bubbles?
- A Look at the Housing Market on a Local and National Level
- Diving into the Decline of Affordability
- When Will We See the Return of a Buyer’s Market?
- 15 Minutes to Read
*Update June 10, 2022: Mortgage Applications Hit 22-Year Low*
An Outlook on Where the Housing Market Could Be Heading
Today, we’re going to spend considerable time looking at the status of the housing market—locally and nationally. We’ll look at some real-life examples from personal experiences of people we know who have agreed to share their stories, along with my own.
We’ll also examine the effect that pandemic policy, inflation, and rising interest rates will have on the housing market in the not-too-distant future. We’ve seen this movie before. If you haven’t, spoiler alert. The movie probably doesn’t end the way you want it to.
A History of Major Housing Market Bubbles
Since 1959, there have been four major housing market bubbles. The most spectacular one in terms of how violently it burst was the last one that peaked in late 2005, early 2006. That was just prior to the onset of the Financial Crisis. The housing market bubble that’s been created in the last two years continues to inflate. There’s no real answer as to how high it will go. Housing is most assuredly a bubble, especially given the number of “experts” who claim it isn’t.
All the housing market peaks we’ve ever seen had their own causes that drove them, like demographics, consumer behavior trends, and other factors. This current housing market is no exception. And since it’s the one we’re concerned with today, let’s dig in and find out what’s going on. We’ll start with some real-world stories, beginning with mine.
My Recent Experience in the Housing Market
My wife and I purchased a lake home on Table Rock Lake in February 2018. At that time, there was a ton of inventory available. We acquired our 2,600-square-foot lake house, which was fully furnished and included a boat slip for $215,000. I almost felt guilty, but I knew that we would most likely never get hurt on that purchase because of the deal we got.
Last year, my lake neighbor sold his lake house on a whim. It wasn’t furnished, didn’t have a boat slip, and is little smaller than mine. Yet he sold it for $325,000. Last month, I checked Zillow to see what they thought my lake house was worth. It was estimated that JUST the house is now worth $365,000. And based on recent sales I’m aware of, my boat slip is worth another $60,000. So, my $215,000 investment is now worth $425,000 to basically double in four years! Mind you, I’m not complaining, but that is NOT normal. And it’s widespread.
The Pandemic’s Impact on the Housing Market
The massive demand for lake homes and the scarcity of existing properties has caused potential buyers to seek out a builder to build their lake home. That means that those builders on the lake are extremely busy…and will charge whatever they think someone is willing to pay.
My Friends’ Recent Experiences in the Housing Market
A friend of mine, who asked to remain anonymous, has had a lake house down the channel from where I’m at for more than a decade now. His location is awesome, but the house needs work…to the point where he was thinking about tearing it down and starting from scratch.
He found the plans that he liked and a contractor to do the work for him, but the contractor wasn’t going to be able to start his project for two years because he was so backlogged.
One day, my friend got a call from the contractor. One of the houses he was supposed to be building got cancelled, so he asked my friend if he wanted to go ahead and take the open spot. They agreed to get together and get the final bid for the project. Keep in mind that my friend already owns the lot. The house was to be somewhere between 1,800 to 2,100 square feet of living area on an unfinished basement, with a garage. The bid? $750,000 to $950,000!!! If you’re trying to do the math in your head right now, that’s $416 per square foot! Obviously, he’s going to wait until things calm down before he proceeds with the project.
The Pain of Phoenix Housing Prices
Another friend also agreed to share his recent real estate story with me. He’s in his late 50s. He and his wife sold their home in Kansas City last April and planned to move to Phoenix and buy or build their new home.
They had been looking prior to selling their Kansas City home and thought they could get what they were looking for at about the price they eventually sold it for. Instead, by the time they got the sale complete and went to buy something in Phoenix, the price of what they wanted had basically doubled. What happened? Well, investors and fleeing California residents is what happened.
As it turns out, 30% of the homes purchased in Phoenix in the year leading up to them being ready to move were purchased by investors, for cash, at way over the asking price. At the same time, California residents were looking to get out while they still could. They flocked to Phoenix with large sums of cash in a market that was much more affordable than the one they just left. That meant they could buy the house of their dreams, with cash, for over asking price (because they still thought it was cheap compared to where they came from) to beat out other prospective buyers.
These phenomena occurring at the same time drove housing market prices up at one of the fastest paces in the nation at roughly 30% per year. It’s also driven the average rent price in Phoenix up from $1,400 a year ago to $2,200 a month today. My friend is a very sharp guy and has done yeoman’s work in researching the housing market (I’ll share some of his research later) to understand what his best course of action is. He’s decided to wait on the Phoenix housing market to cool off and make alternate plans for the interim. I’m not at liberty to say what it is, but…his alternate plan is awesome if you ask me.
Understanding the Current Housing Market and What Could Be Next
I share these three stories to give you some real-world context to the information we’re going to cover next to help understand the overall real estate market today and what’s likely to be next.
Unaffordable Housing Prices
Clearly, with home prices increasing at the rate they are, homes are becoming increasingly unaffordable. That’s especially true for the first-time homebuyers. Rising prices by themselves are bad enough, but when you add rising mortgage rates on top of rising prices, you get an acceleration of the decline in affordability.
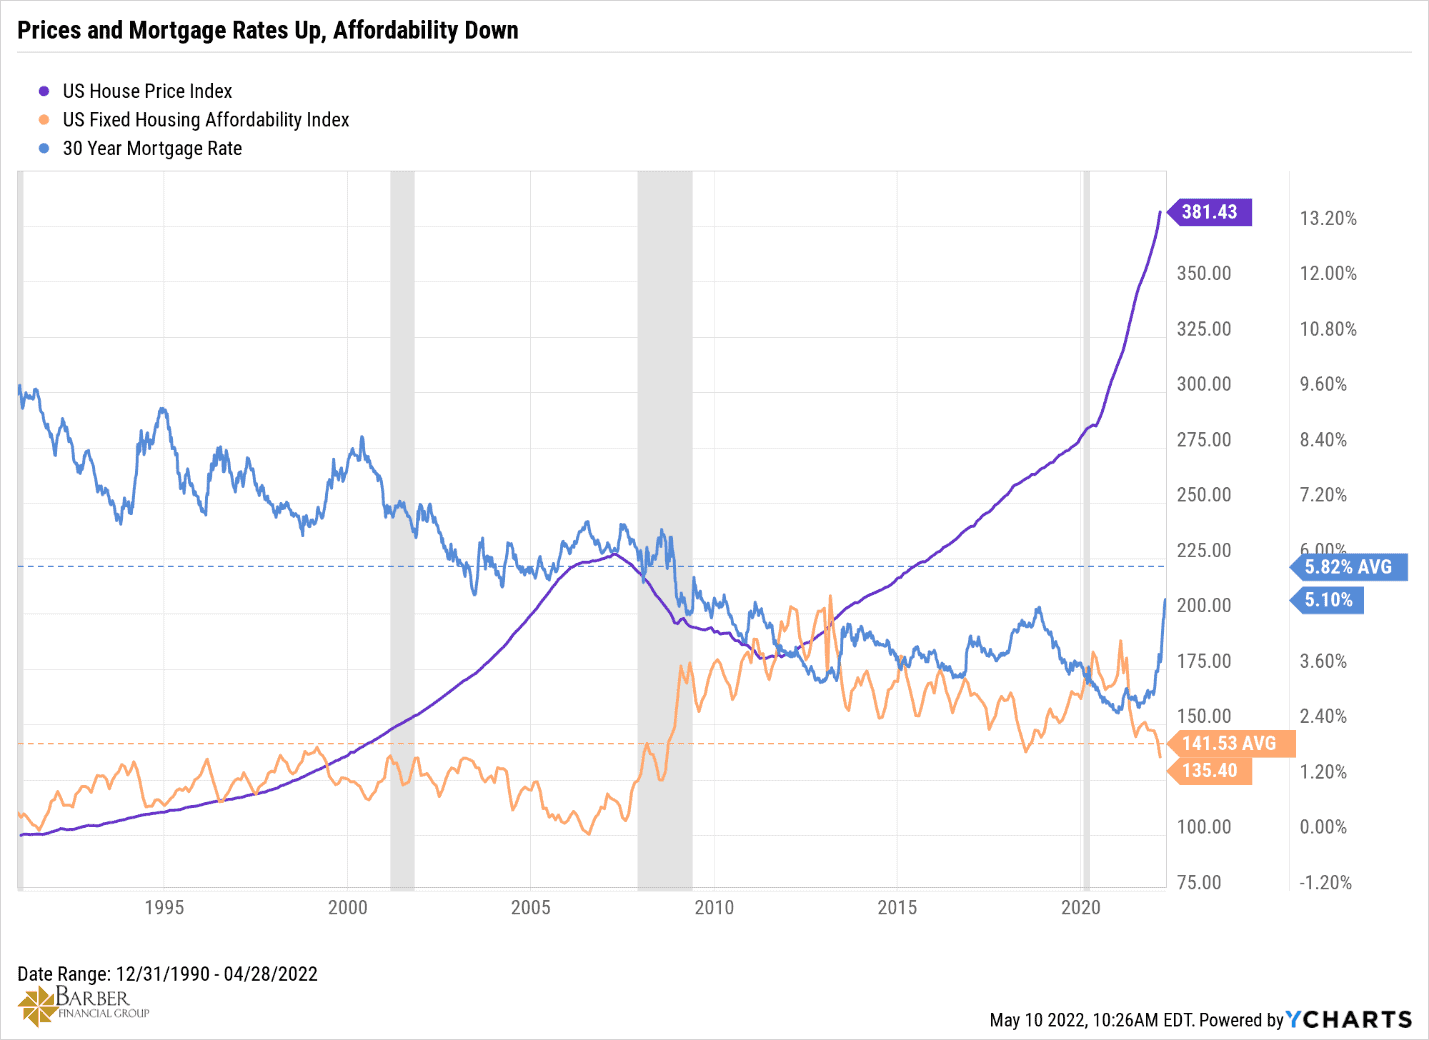
FIGURE 1 | Prices and Mortgage Rates Up, Affordability Down | YCharts
Looking above at Figure 1, you can see that affordability is now back to the level we saw just prior to the Financial Crisis. Interest rates on a typical 30-year mortgage are also nearing their levels in that same period.
Diving into the Decline of Affordability
If we continue to see 17% yearly average price growth on a national level and mortgage rates eclipse the 6% level, we could see affordability fall to the levels we saw at the peak of the last housing market bubble in 2006. In fact, the data from Figure 1 hasn’t updated to the latest reading. According to the National Association of Realtors, affordability is at 124 as of March 31. In the west region, it’s now below 100 at 97.1. That is a sharp decline from the 123.7 it was at a year ago.
When Will We See the Return of a Buyer’s Market?
The decline in affordability begins to exclude a larger and larger portion of the buyers pool from the housing market. The smaller pool of qualified buyers eventually leads to lower demand (demand destruction). That leads to lower prices in the form of price drops in the asking price by the seller, which eventually leads to lower real values. Finally, it culminates in the return of a buyer’s housing market. But when?
Well, if you listen to some people, they think that this time is different. That was also their belief in 2006. They think that home prices will continue to go up at a double-digit pace and that the demand will not subside for several years. Those people are convinced or have convinced themselves that there is a vast shortfall in available housing inventory. They believe we need to build at least 5-7 million more homes in the next few years just to get inventory to where it needs to be. However, they might be missing some clues that tell a different story.
What Can We Learn from the Population to Housing Unit Ratio?
Clue No. 1 is the population to housing unit ratio. Never heard of it? Neither had I until recently. It’s interesting and tells a story that some in the real estate business don’t seem to know.
The population of the United States today is around 332 million, give or take a million or two. The United States contains 142 million housing units to house the population. There are 95 million single family homes and 47 million condos and apartments. That equals 2.4 people per housing unit, which is the lowest level ever recorded in this country.
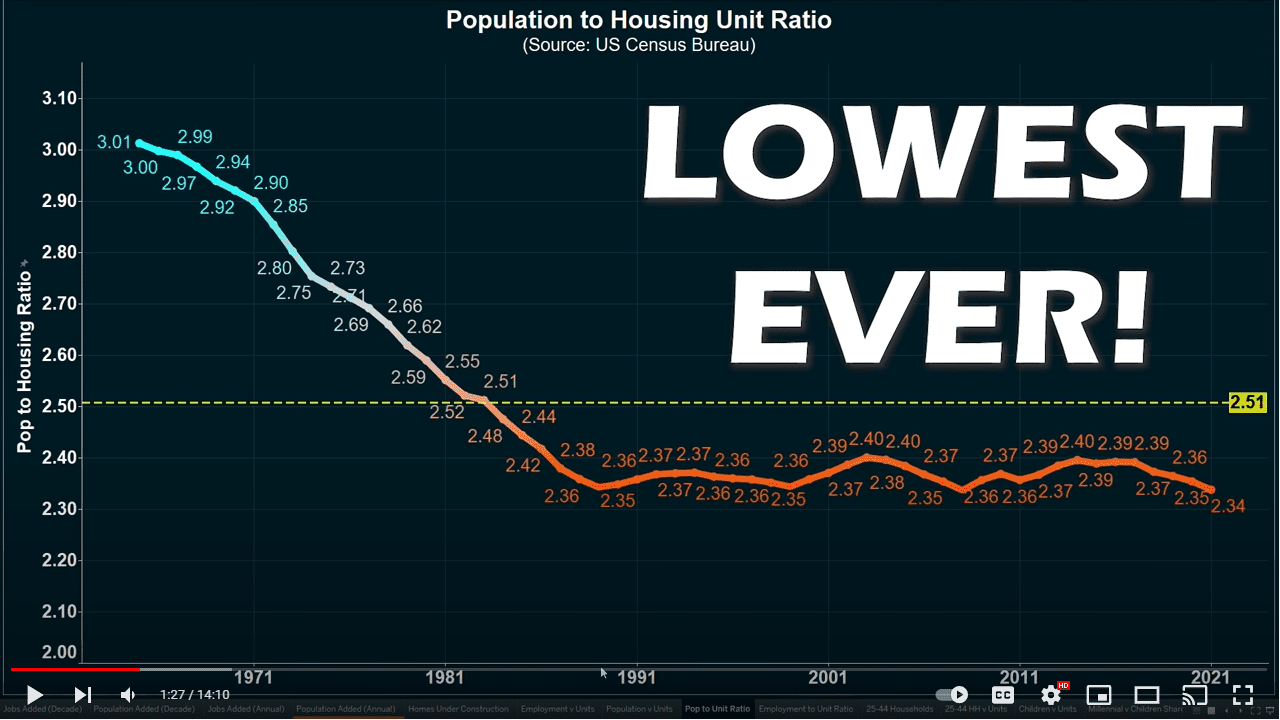
FIGURE 2 | Population to Housing Unit Ratio | U.S. Census Bureau
Figure 2, above, came from Reventure Consulting’s YouTube Channel on April 27. The title of the video “How the U.S. Government RIGGED the 2022 Housing Bubble” is a little inflammatory, but the content is very good.
In fact, Reventure Consulting has a ton of videos. If you like this kind of stuff, I recommend you look around after watching the aforementioned video. I’ll use some more of his data to share the gist of the 14-minute video.
If the population to housing unit ratio is so low, why do people think we have a shortage of houses available for purchase? Well, because we kind of do…temporarily. Allow me to explain.
A Temporary Shortage of Houses on the Market?
As you’re aware, a lot of things changed when the pandemic hit in 2020. One of the things that changed was the ability of banks to foreclose on mortgage holders and landlords to evict their tenants. Those were supposed to be temporary measures to protect people who were unable to work through no fault of their own because of the lockdowns.
But they weren’t temporary, at least not temporary enough. The measures were extended over and over, and only ended this year. What effect did that have on the housing market? Check out Figure 3 below.
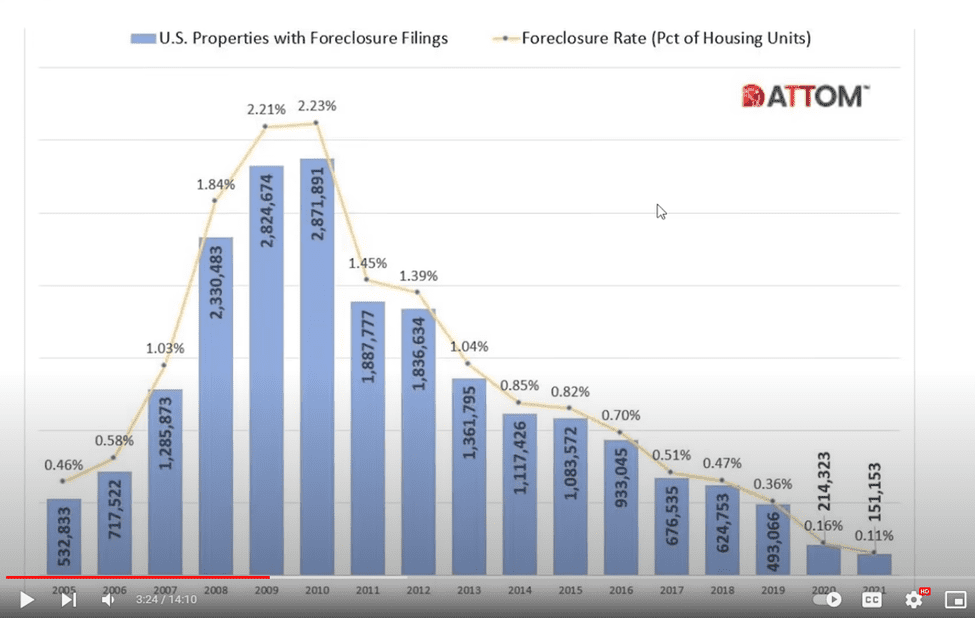
FIGURE 3 | U.S. Property Foreclosures | ATTOM
Foreclosure Delays
In 2018 and 2019 combined, there were 1.12 million foreclosures. Because of the moratoriums, 2020 and 2021 combined only saw 360,000 foreclosures. Those foreclosures that were delayed would have been added to the available inventory of houses available to purchase…but they weren’t. It’s very likely that those foreclosures that were postponed will begin to occur soon. In fact, they’re already starting. More on that in just a bit.
So, taking what we know from Figure 3, let’s look below at Figure 4 and see if we can do some math together.
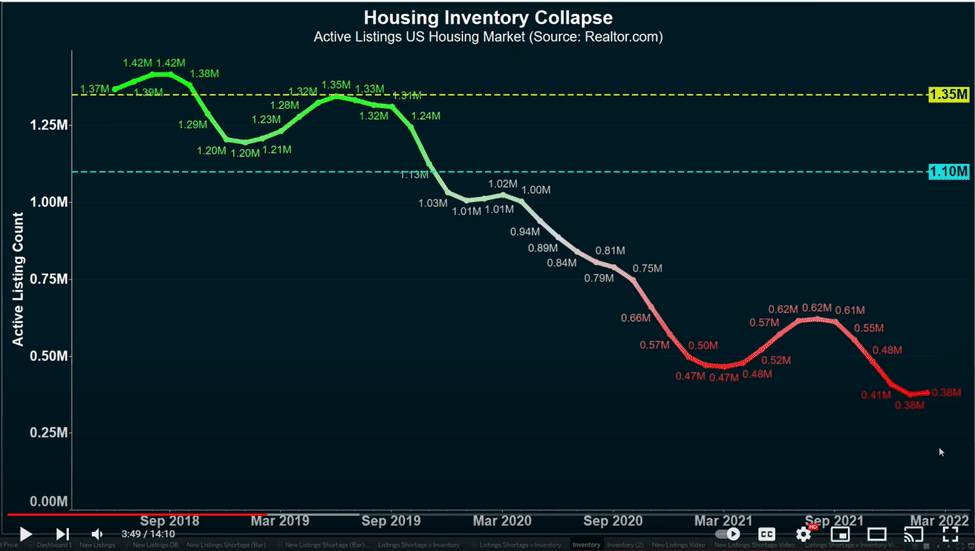
FIGURE 4 | Housing Inventory Collapse | Realtor.com
The Lack of Active Listings
The number of active listings for homes has dropped to 380,000 as of March. There were roughly 760,000 foreclosures that were postponed in 2020 and 2021 that would have been (will be soon) in the available inventory of homes. If you add the current active listings to the postponed foreclosures, you come up with 1.1 million available homes, which is only a little bit below the average inventory of active listings seen in 2018 and 2019 of 1.35 million.
There’s another reason for the lack of active listings, which I alluded to earlier. I’m referring to the pandemic-induced migration, particularly among those seeking second or vacation homes. As you can see below in Figure 5, demand for second houses was up 91% from pre-pandemic levels in January of 2021 and remained super elevated for the next 12 months. That was a lot of inventory taken off the market by that group of people.
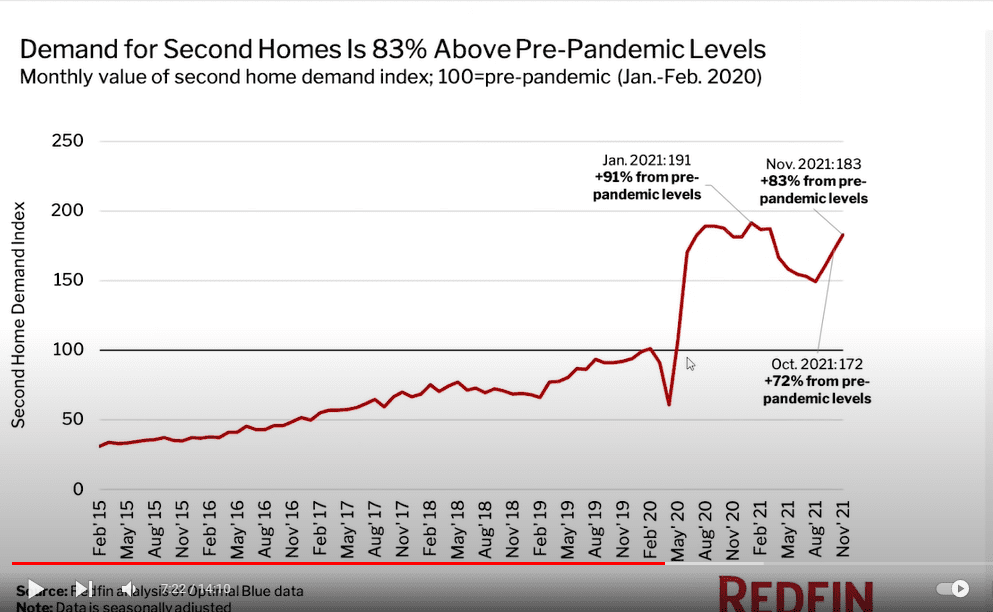
FIGURE 5 | Demand for Second Homes Is 83% Above Pre-Pandemic Levels | Redfin
But It’s Not All Bad News
The good news for inventory levels on that front is that demand for second and vacation homes has dropped precipitously and is now just 13% above pre-pandemic levels. That will leave more room for those seeking primary homes, where the demand is still 34% above pre-pandemic levels.
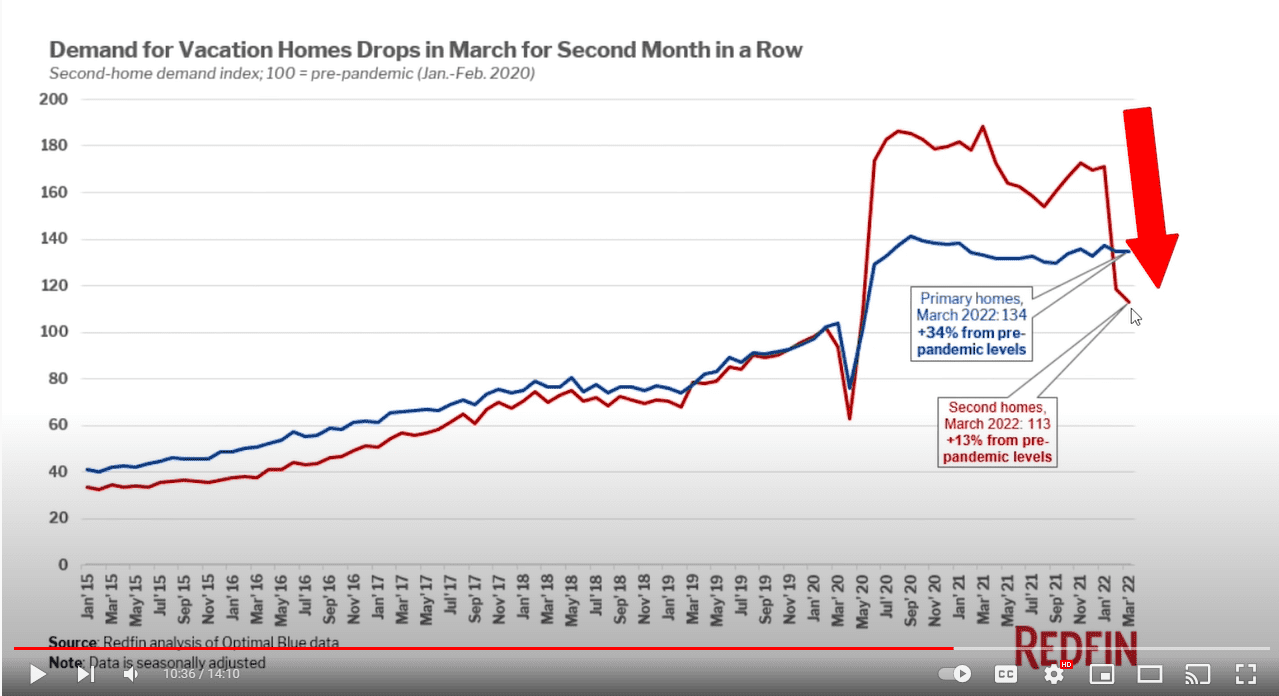
FIGURE 6 | Demand for Vacation Homes Droops in March for Second Month in a Row | Redfin
New Residential Construction
Now, let’s look at new residential construction with some data from the U.S. Census Bureau in Figure 7.
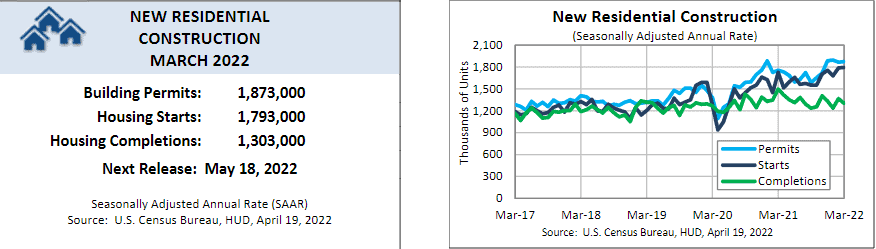
FIGURE 7 | New Residential Construction | U.S. Census Bureau
It’s clear that the building industry is trying to fill the demand void, whether it’s real or not. They are building at a faster pace than they have been in the last five years. Completions are slowing a little, mainly due to the persistent supply chain issues and tight labor conditions.
But look at the starts and permits. Annualized starts in March were 1.793 million units and new building permits for homes that will be started later were up to 1.873 million units. That’s a ton of inventory that’s going to come onto the market in the next six to 12 months. Normally, I would say that’s a good thing. We’re not in a normal situation though, so I have some reservations.
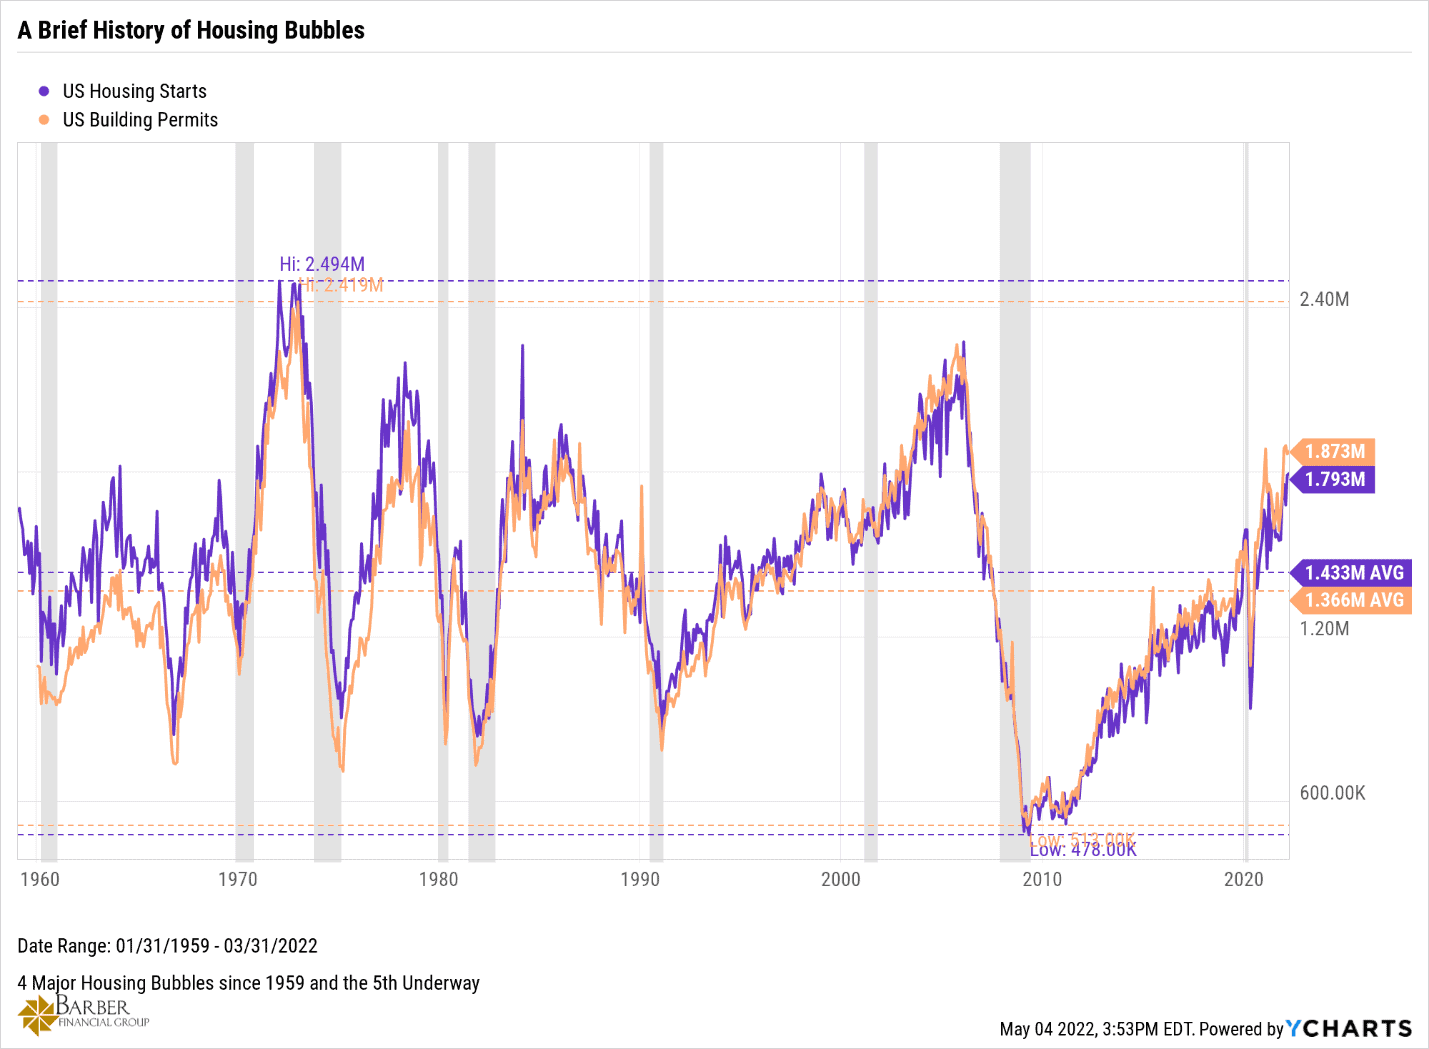
FIGURE 8 | A Brief History of Housing Bubbles | YCharts
Figure 8, above, is a longer look at starts and permits and gives us some historical context for where we might be in the current housing market cycle. Permits and starts are well above their historical averages and not far below the levels we’ve seen at the peak of each of the last four major housing market bubbles we’ve seen in the last 60-plus years.
Median Income Illustrates How This Housing Bubble Looks Different from 2005-2006
According to an article titled, Housing Bubble 2.0, from The Epoch Times on May 9, the median income to home price ratio has climbed well past the level it reached in the last housing bubble. It’s currently setting at 7.72, which means it takes 7.72 times the median income to buy the average home today. That ratio last peaked at 7.03 in November 2005.
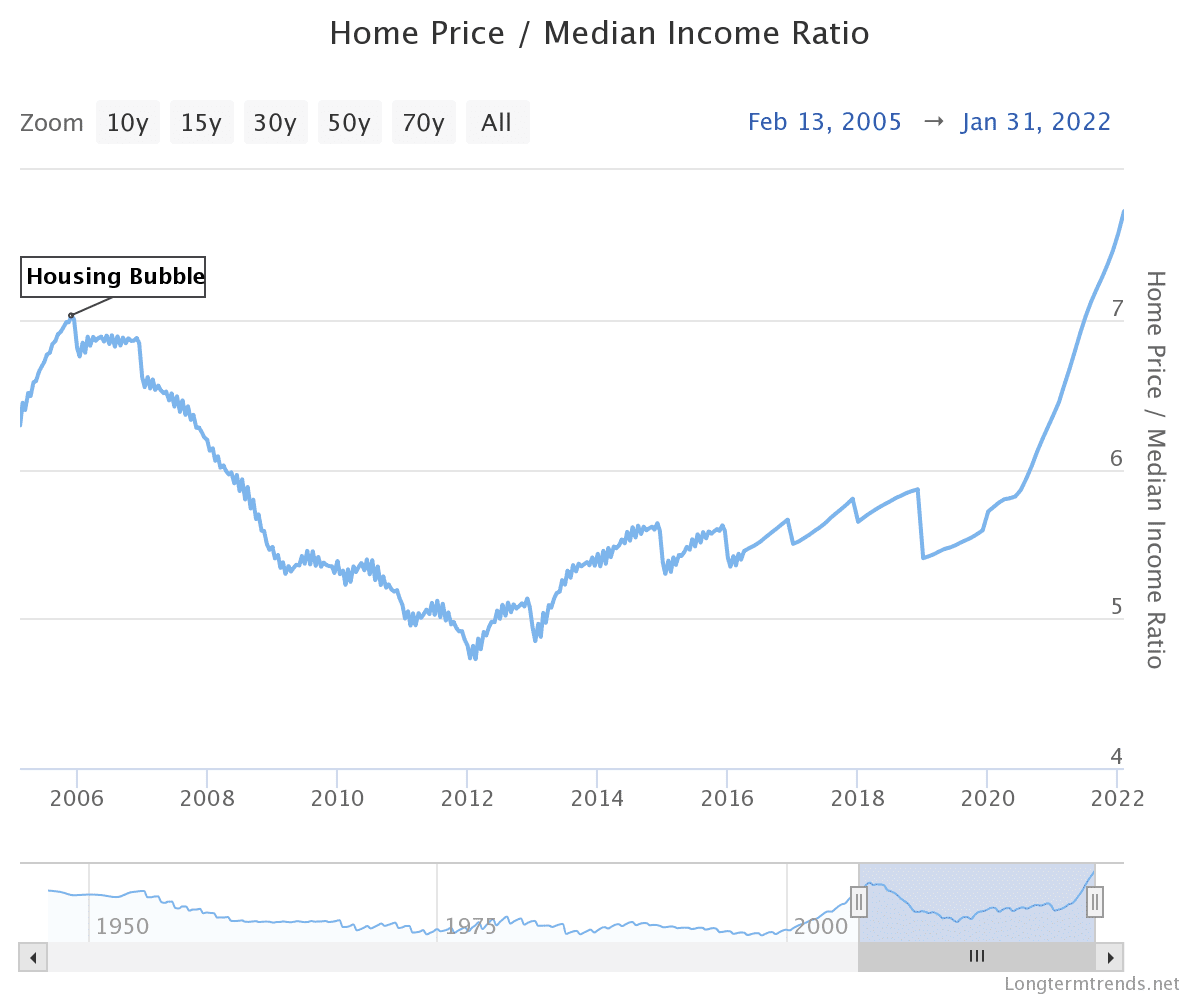
FIGURE 9 | Home Price/Median Income Ratio | Longtermtrends.net
In the same article, they reference the latest report from realtor.com that shows home prices increased by 14.2% year over year in April and that the median listing price for a home is now $425,000. The number of potential buyers who are being priced out of the market grows in direct correlation to the growth in home prices.
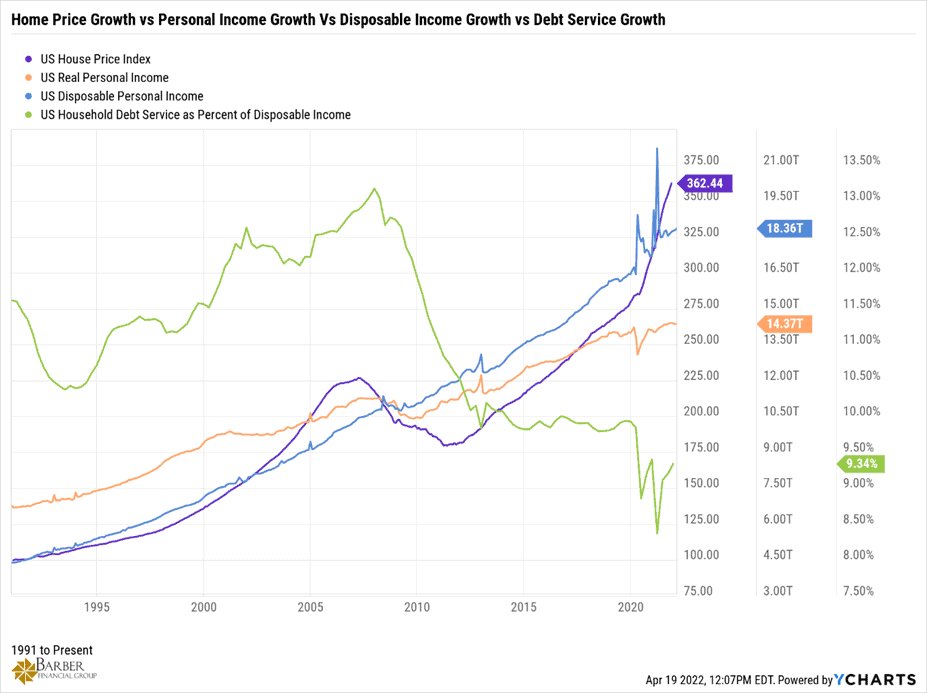
Debt Service Levels on the Rise
For the last 12 years, the amount of income the typical family had to spend on debt service has gone down rather dramatically as interest rates fell to and remained at historic lows. Now, as interest rates quickly rise from those lows, so will the amount of income dedicated to debt service. And, as you can see below Figure 10, debt service levels are already on the rise.
In fact, the average mortgage payment is up 39.4% year over year at $2,349 compared to $1,400 at the end of 2020 and $1,700 at the end of 2021. The rate on 30-year mortgages has climbed to a national average of 5.48%, nearly twice as high from 2.65% it was at in January 2021.
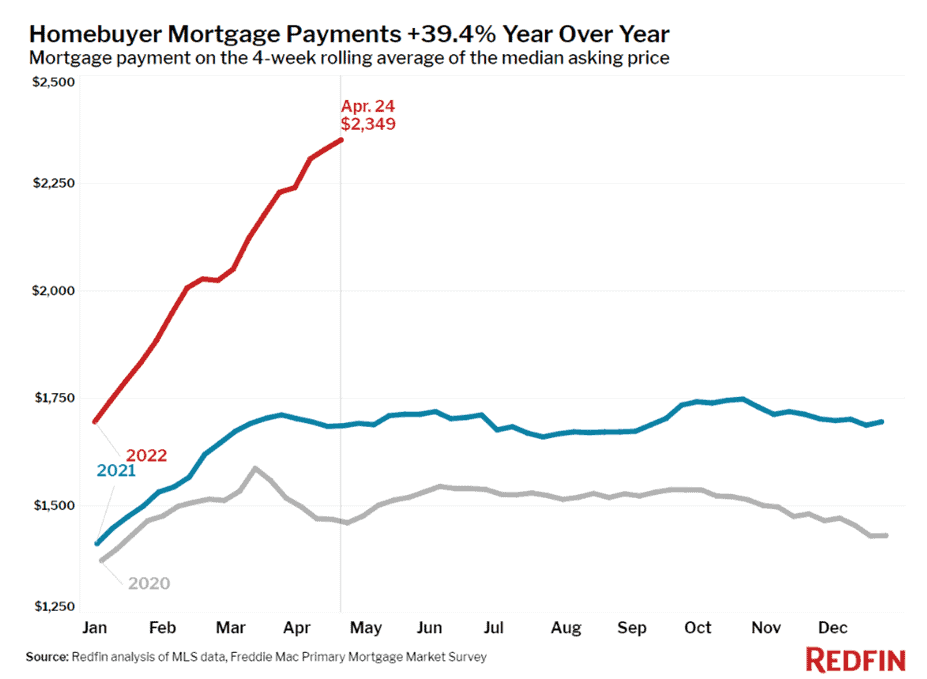
FIGURE 11 | Homebuyer Mortgage Payments +39.4% Year Over Year | Redfin
How Student Debt Fits in the Housing Market Big Picture
Then, there is the issue of the $1.59 trillion in student loan debt outstanding. Repayments on those loans were paused in the first quarter of 2020 and are still paused. What will happen when the payments must begin again? Well, debt service will obviously go up and disposable income will go down. Whether or not it materially affects someone who has those debts to repay and their ability to purchase a home, it will undoubtedly affect their decision on an emotional level. That’s just human nature.
And there are, unfortunately, a good number of people with student loan debt that believe the government is going to forgive that debt, so they don’t have to repay it. The idea makes a great political football for candidates to kick around, but simply is giving these people a false sense of hope because it’s unlikely to become a reality.
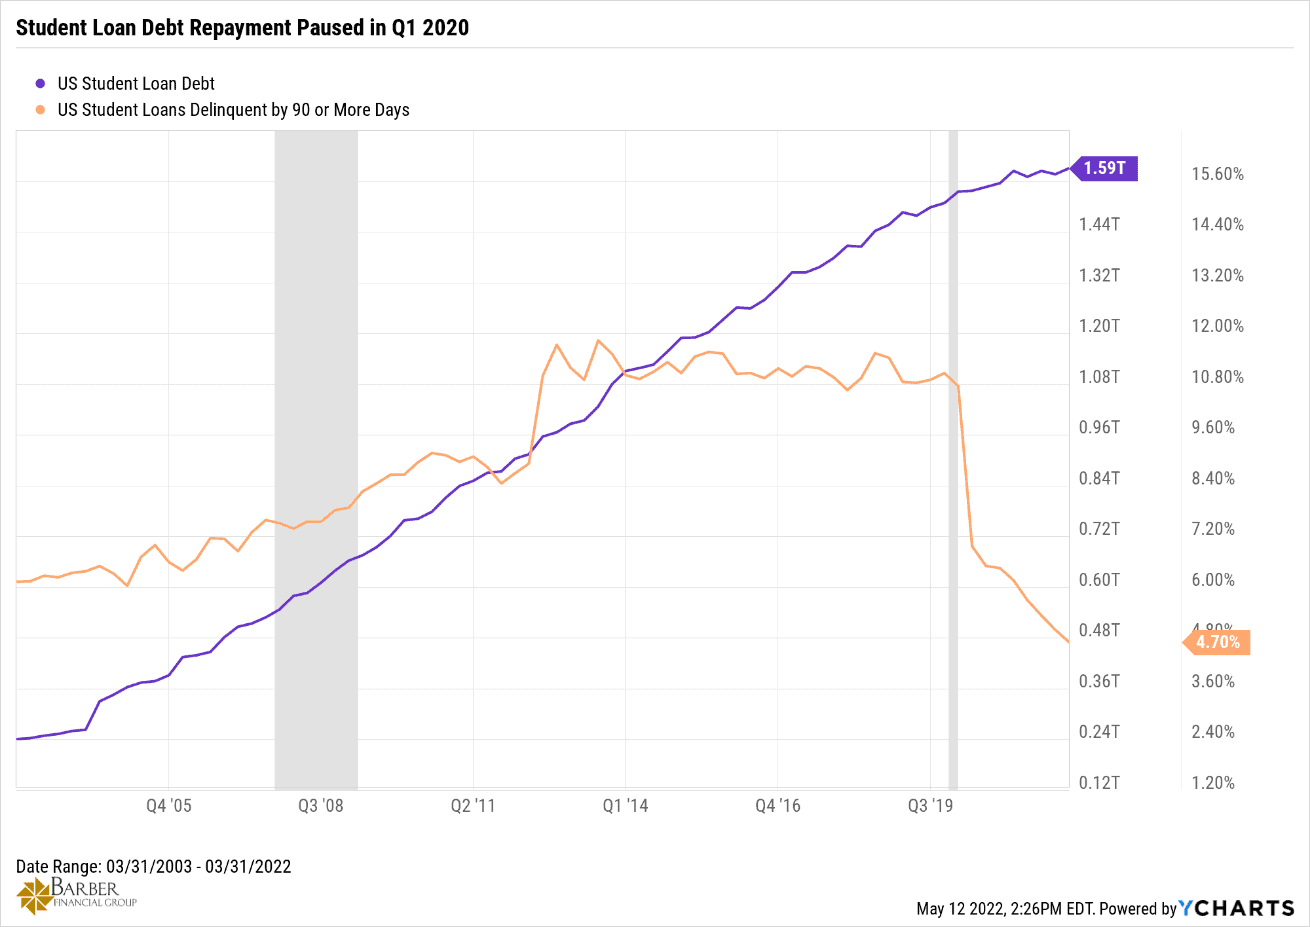
FIGURE 12 | Student Loan Debt Repayment Paused in Q1 2020 | YCharts
No matter how those holding the student loan debt look at the issue, the fact that it may have a material effect on the future of the housing market is undeniable. Remember, many people holding this student loan debt are part of the millennial (echo boomer) generation—those between about 26 and 42. Ninety percent of younger millennials have at least an associate degree. Millennials represent 43% home buyers as of March, which up from 37% the year before. They are also the largest generation in U.S. history.
Millennials have the demographic size to affect the housing market in meaningful ways. They can change the face of the economy just like the baby boomers did once they began entering the economy in the mid ’60s. Let’s hope the student loan debt doesn’t slow them down too much.
A Big Spike in Foreclosures
Now let’s discuss the foreclosures I mentioned earlier. When the foreclosure moratorium expired in January, foreclosure starts jumped by 700% from the year prior with 23,204 foreclosure filings. Granted, the year over year comparison is bound to be big considering that the moratorium was in place last year, but that’s still a big number.
The foreclosures continue to increase each month. ATTOM reported that there were 78,271 foreclosure filings in the first quarter of 2022. The rate of foreclosures is approaching the pre-pandemic levels we saw in 2018 and 2019. That means inventory is going to be coming onto the market, which will begin to slow the price growth.
Below in Figure 13, you can see that the number of homes selling for over their asking price is dropping quickly. It was down near 40% by the end of March, which is good news for potential buyers.
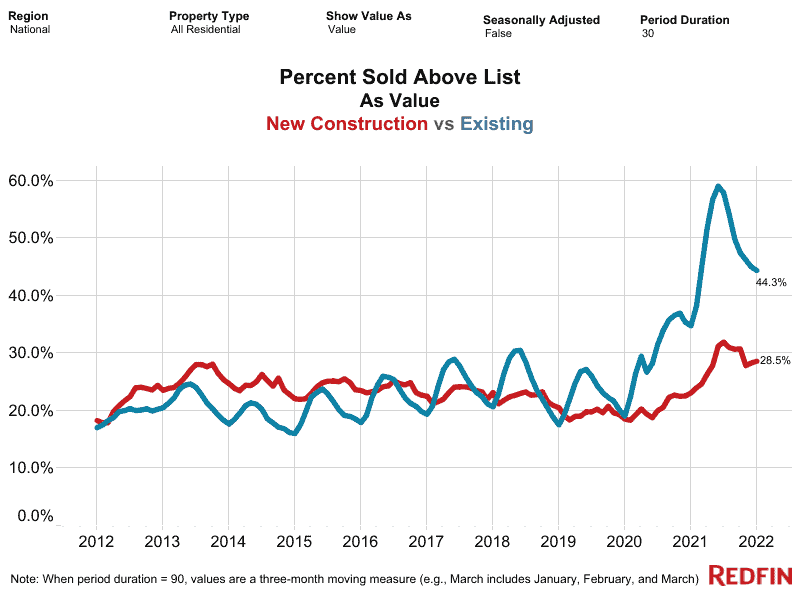
FIGURE 13 | Percent Sold Above List as Value – New Construction vs. Existing | Redfin
Rising Prices and Bidding Wars
The rising prices and bidding wars are chasing buyers away, at least for a while. It’s not a big drop yet, but Redfin’s Homebuyer Demand Index is down year to date and is 1% lower than at the same time last year. Perhaps it’s just a blip on the radar. Or perhaps it’s a sign that the demand destruction I mentioned earlier is beginning to take shape. We’ll know soon enough.
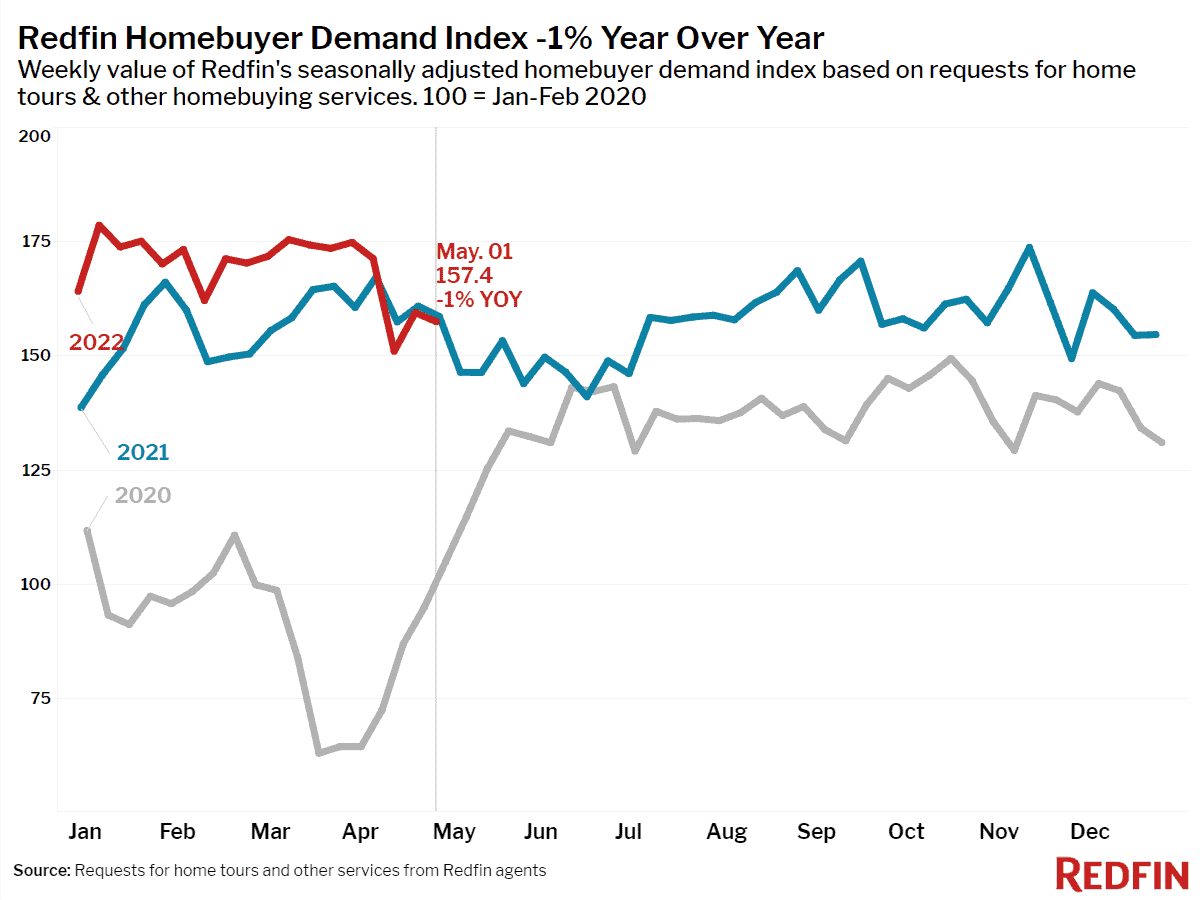
FIGURE 14 | Redfin Homebuyer Demand Index -1% Year Over Year | Redfin
The supply chain issues have caused a lot of pain for all of us over the last two years and have had some unsavory effects on buyers of new homes. As you all know, labor, lumber, appliances, and other raw materials were in short supply. What that caused was huge delays in the time it took to complete a home for a new home buyer, with completion taking six to 12 months…or longer.
Not only was it painful for these new home buyers to wait that long for a house, but a lot of them got within days of closing only to have the home builders cancel buyers’ contracts right before closing and then sell their home to another buyer who was willing to pay more. There are tons of stories like that and they’re sad to say the least.
The Ethical Dilemma of Home Builders
Most builders’ contracts allow them to cancel for any or no reason, and a lot of them have done so. Thanks to delays caused by the supply chain issues and rapid increases in values we’ve seen over the last two years builders have found themselves in a bit of an ethical dilemma.
Imagine signing contracts with a buyer to build them a house for a specified amount of money. Let’s say for the sake of this example that it’s $300,000 and by closing time its market value reaches $360,000. As a builder, do you leave that extra $60,000 on the table? Or do you cancel the contract and sell it to someone else at the current value?
I wouldn’t be able to sleep at night if I sold the house out from under someone. But remember, I used to be in the home building business. There are some…shall we say… not so ethical players in that game. So, I’m not surprised that some opt for the extra $60,000. But the tides are turning.
The Housing Market Is a Very Interest Rate Sensitive
Buyers are now cancelling contracts on builders under the financing clauses that allow them to back out if their financing falls through or the terms are not acceptable. With interest rates on 30-year loans skyrocketing, this is going to become common place. That means that a lot of homes under construction right now that are “sold” will wind up being added to the list of homes in inventory.
Housing is one of the most interest rate sensitive segments of our economy. The Fed is not doing any favors right now for anyone in the housing market—buyer or builder. They’re focused on getting inflation under control. Like a horse with blinders on, they don’t/won’t see what they’re doing to the housing market until it’s too late.
The Astounding Increase in Rent Prices
And then you have the single family “built-for-rent” phenomenon, which is exploding. Phoenix, Columbus, Dallas, Houston, Riverside, Vegas, and Kansas City are the top seven metro areas in the country with built-to-rent housing developments.
The increase in rent prices annually has been tremendous. Therefore, the developers of these communities are betting that rents continue to increase at the same rate they have. In fact, they need them to. Many of the properties are being built/were built at the highest prices for raw materials we’ve seen in decades.
If, as I suspect, home values stagnate and rent prices fall, these properties are going to go from rentals to homes available for sale as the companies responsible for building these communities try to monetize the assets while they still can. The profit margins on some of these developments are in the low-single digit range. They NEED rent increases to make them profitable in the long term. Imagine if rent prices fall by 10% in the next 12 to 24 months. How long do you think it will take for these homes to hit the open market? My guess…24 hours.
How a Housing Market Shortage to Becomes a Surplus
At the same time, there are 800,000 apartment units under construction in the U.S. right now. That’s almost double the number that were under construction in the peak of the last housing bubble in 2006! Rent increases are not in the cards. Just the opposite.
When all these things we’ve discussed come together, the current perceived housing market shortage is going to become a housing market surplus, seemingly overnight. In reality, it will take months to unfold. But our memories are short and inaccurate, so it will feel like it happened overnight. And the so-called experts will blather on and on about how “no one could have seen this coming” or some such inanity.
Avoiding Emotional Decisions
The human tendency to make projections by looking at today and assuming things will always be so in the future is the reason we have bubbles. And this time is no different.
If you want to sell your house, the next six to 12 months is likely the best time to do so. After that, you may have to take less for it than you think it’s worth today. And if you’re wanting to buy a house, the reverse is the case for you. Especially today, avoid emotional decisions where housing is concerned. There’s too much at stake.
Schedule Complimentary Consultation
Select the office you would like to meet with. We can meet in-person, by virtual meeting, or by phone. Then it’s just two simple steps to schedule a time for your Complimentary Consultation.
Lenexa Office Lee’s Summit Office North Kansas City Office
Investment advisory services offered through Modern Wealth Management, Inc., an SEC Registered Investment Adviser.
The views expressed represent the opinion of Modern Wealth Management an SEC Registered Investment Advisor. Information provided is for illustrative purposes only and does not constitute investment, tax, or legal advice. Modern Wealth Management does not accept any liability for the use of the information discussed. Consult with a qualified financial, legal, or tax professional prior to taking any action.