What Is Driving the Stock Market?
Key Points – What Is Driving the Stock Market?
- The U.S. Treasuries Yield Curve Remains Steeply Inverted
- Are We in a Tech Bubble?
- What Is Driving the Stock Market and Is It Sustainable?
- Looking at Some P/E Ratios That Are Out of Control
- 5 Minutes to Read | 7 Minutes to Watch
The data in today’s article is as of June 28, 2023.
What Is Driving the Stock Market?
The U.S. treasuries yield curve is still very steeply inverted, pointing to a potential economic slowdown. And the returns in the market are coming from a very narrow group of stocks. What exactly is driving the stock market? I’ll tackle that and more in my June Monthly Economic Update.
Are We in a Tech Bubble?
Last month, we asked the question, “Are we in a tech bubble?” I’m going to go through a few things a little bit differently this month to point out some things that most people may not realize. Let’s jump in with a year-to-date view of the broad market in Figure 1.
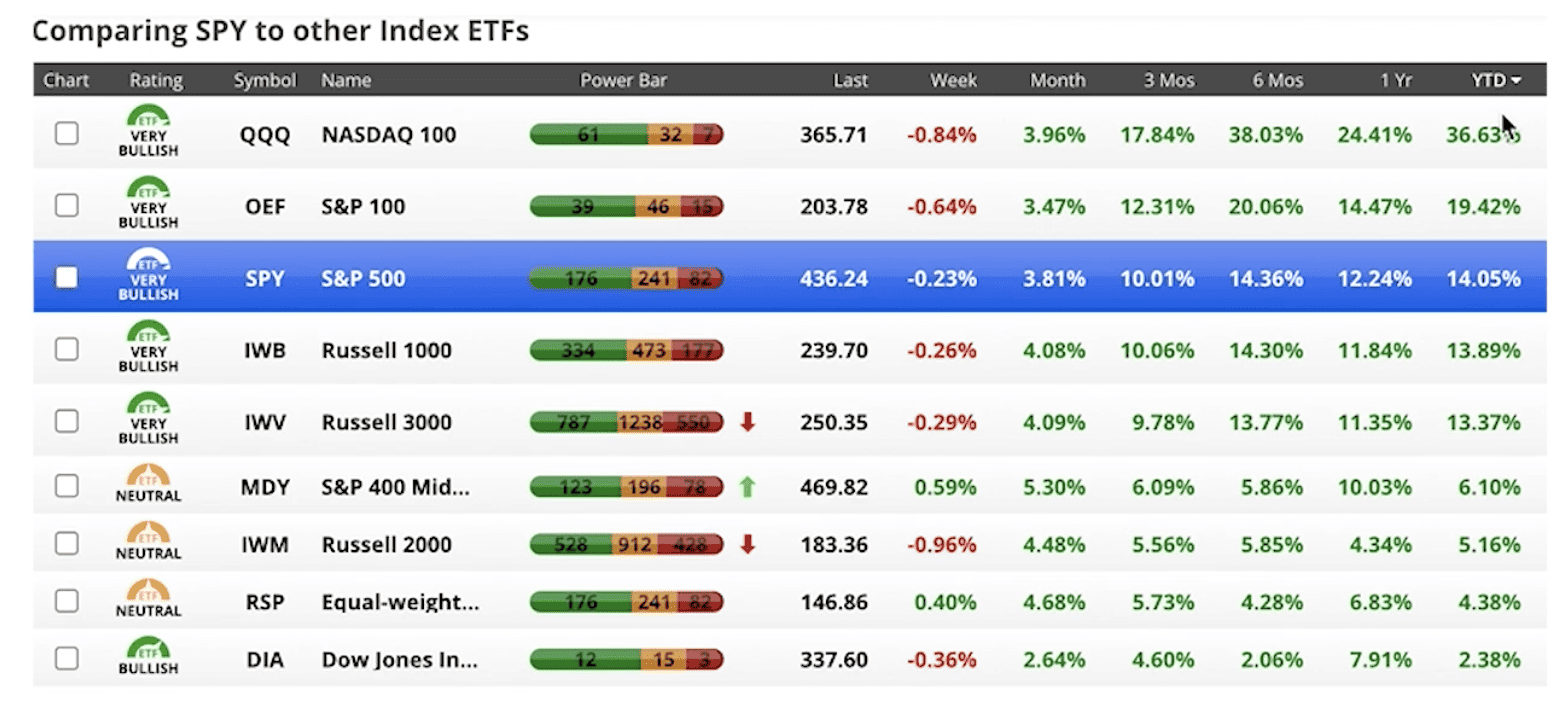
FIGURE 1 – Year-to-Date Market Performances – Chaikin Analytics
The Nasdaq is up 36.63% so far this year. The Dow Jones Industrial Average is the worst performing index, up only 2.38% this year. So, we have a big divergence between the Nasdaq and the Dow Jones Industrial Average.
Only a Handful of Stocks Are Driving the Stock Market
The S&P 500 is up by 14.05% this year. If we look at the top several stocks in the S&P 500, we’ve got Apple, Microsoft, Amazon, Nvidia, Google, and Meta. They’re making up 26% of the S&P 500. That’s our first look at what is driving the stock market.
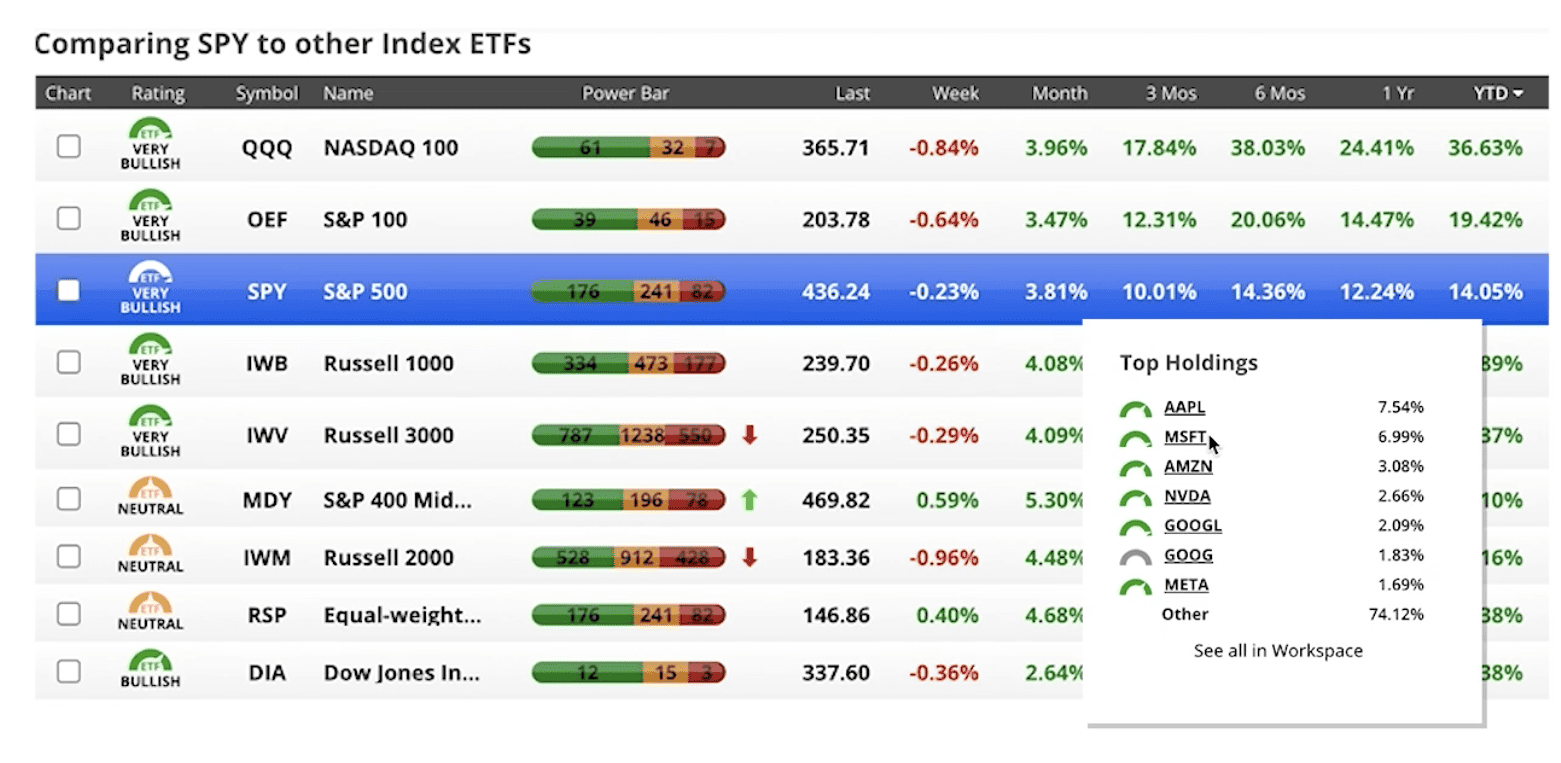
FIGURE 2 – S&P 500 Top Holdings – Chaikin Analytics
I also want to point out something else. The RSP, which is an ETF that is an equal weight of the S&P 500, meaning that it owns all 500 stocks in equal weights. It’s only up 4.38% this year. That tells us that these big tech stocks in the S&P 500 are what is driving the returns. That’s our second look at what is driving the stock market.
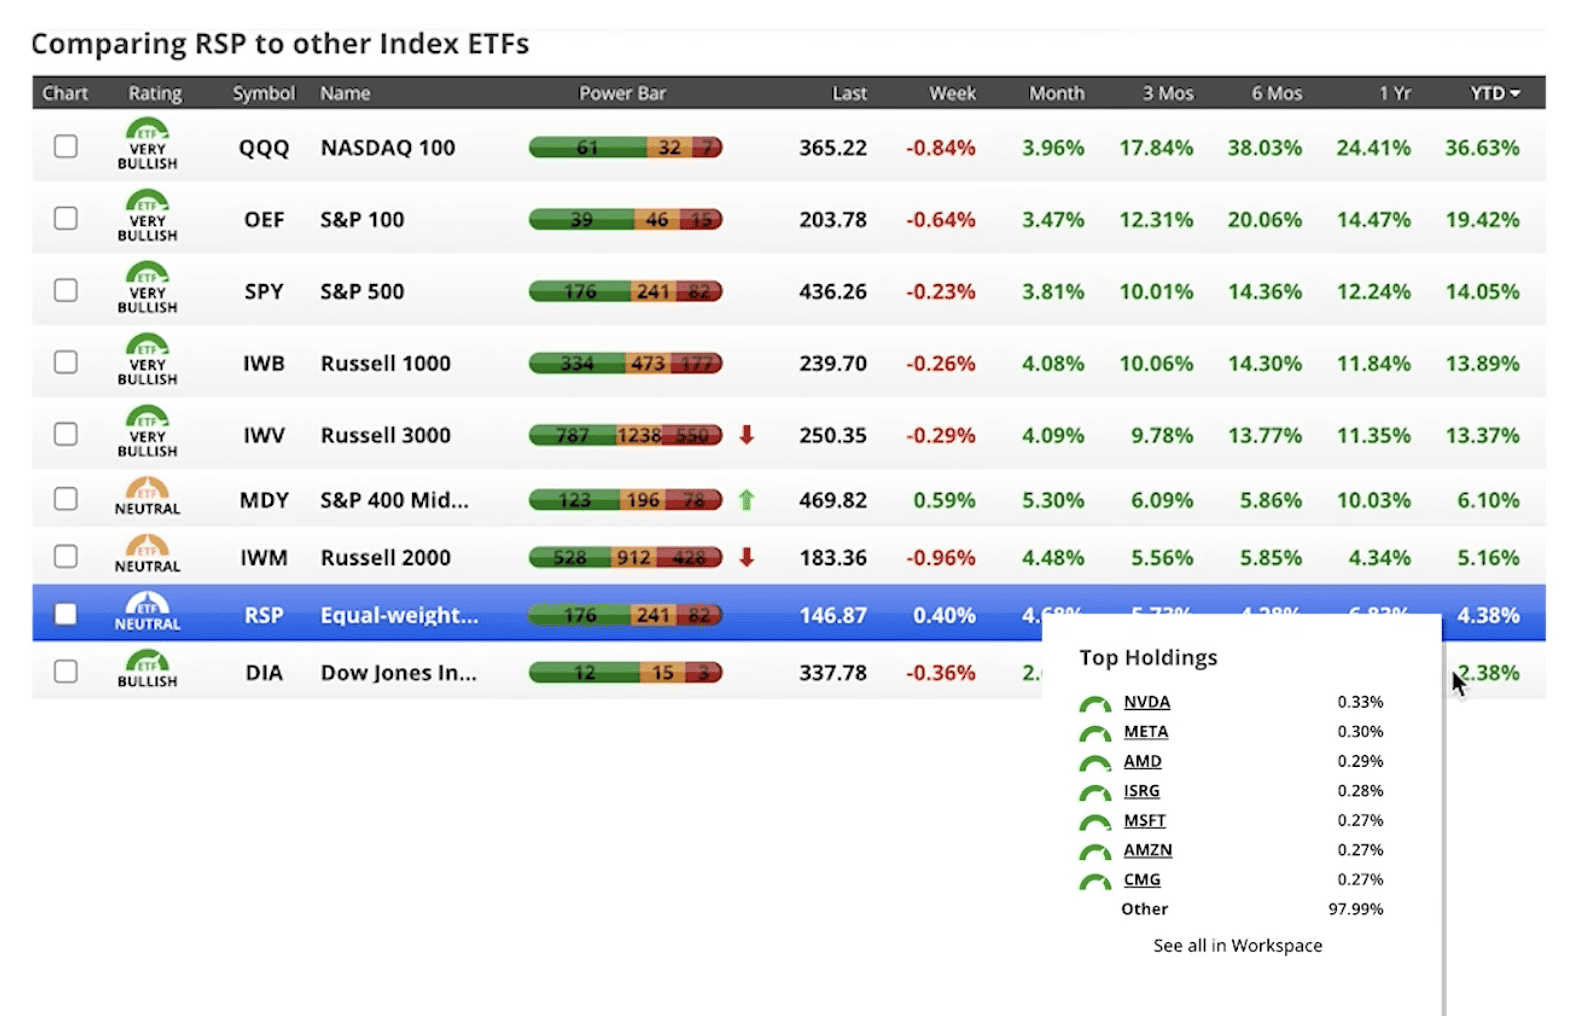
FIGURE 3 – RSP Equal-Weighted Top Holdings – Chaikin Analytics
The last time we saw the divergence this big between the equal weight and the S&P 500 cap weight was 1999, right at the height of the tech bubble. Now, I’m not saying that there’s a tech bubble. I’m just posing the question. Is it possible we are in a tech bubble?
I want to take it one step further. If we look at the NASDAQ 100, which consists of 100 stocks. Those same stocks that make up 26% of the S&P 500 make up 51% of the Nasdaq-100. That’s our third look at what is driving the stock market. Most of the returns that are coming out of the Nasdaq and S&P 500 are tied to just a handful of stocks.
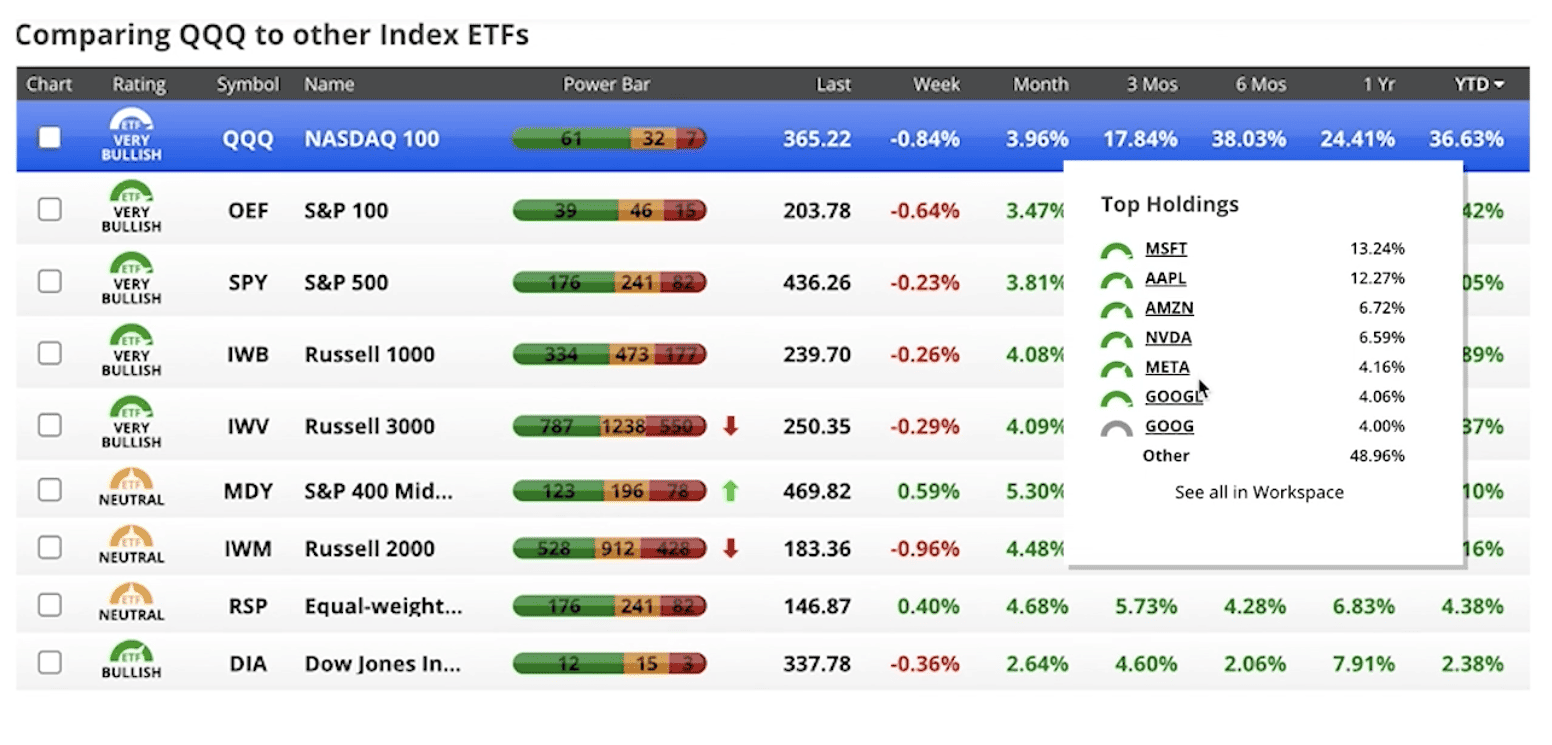
FIGURE 4 – Nasdaq-100 Top Holdings – Chaikin Analytics
This is a very narrow market rally. A lot of it is tied to the hype around artificial intelligence. This begs a few questions. Is what we’re seeing happening in the Nasdaq sustainable? Is what’s happening in these big tech companies sustainable? Or is this a setup for people to get hurt when these things turn around?
Some Wild Price-to-Earnings Ratios
If we look at Amazon’s price-to-earnings ratio, it’s about 316 according to CNBC’s live tracker. So, 316 times next year’s earnings is what Amazon is trading at.
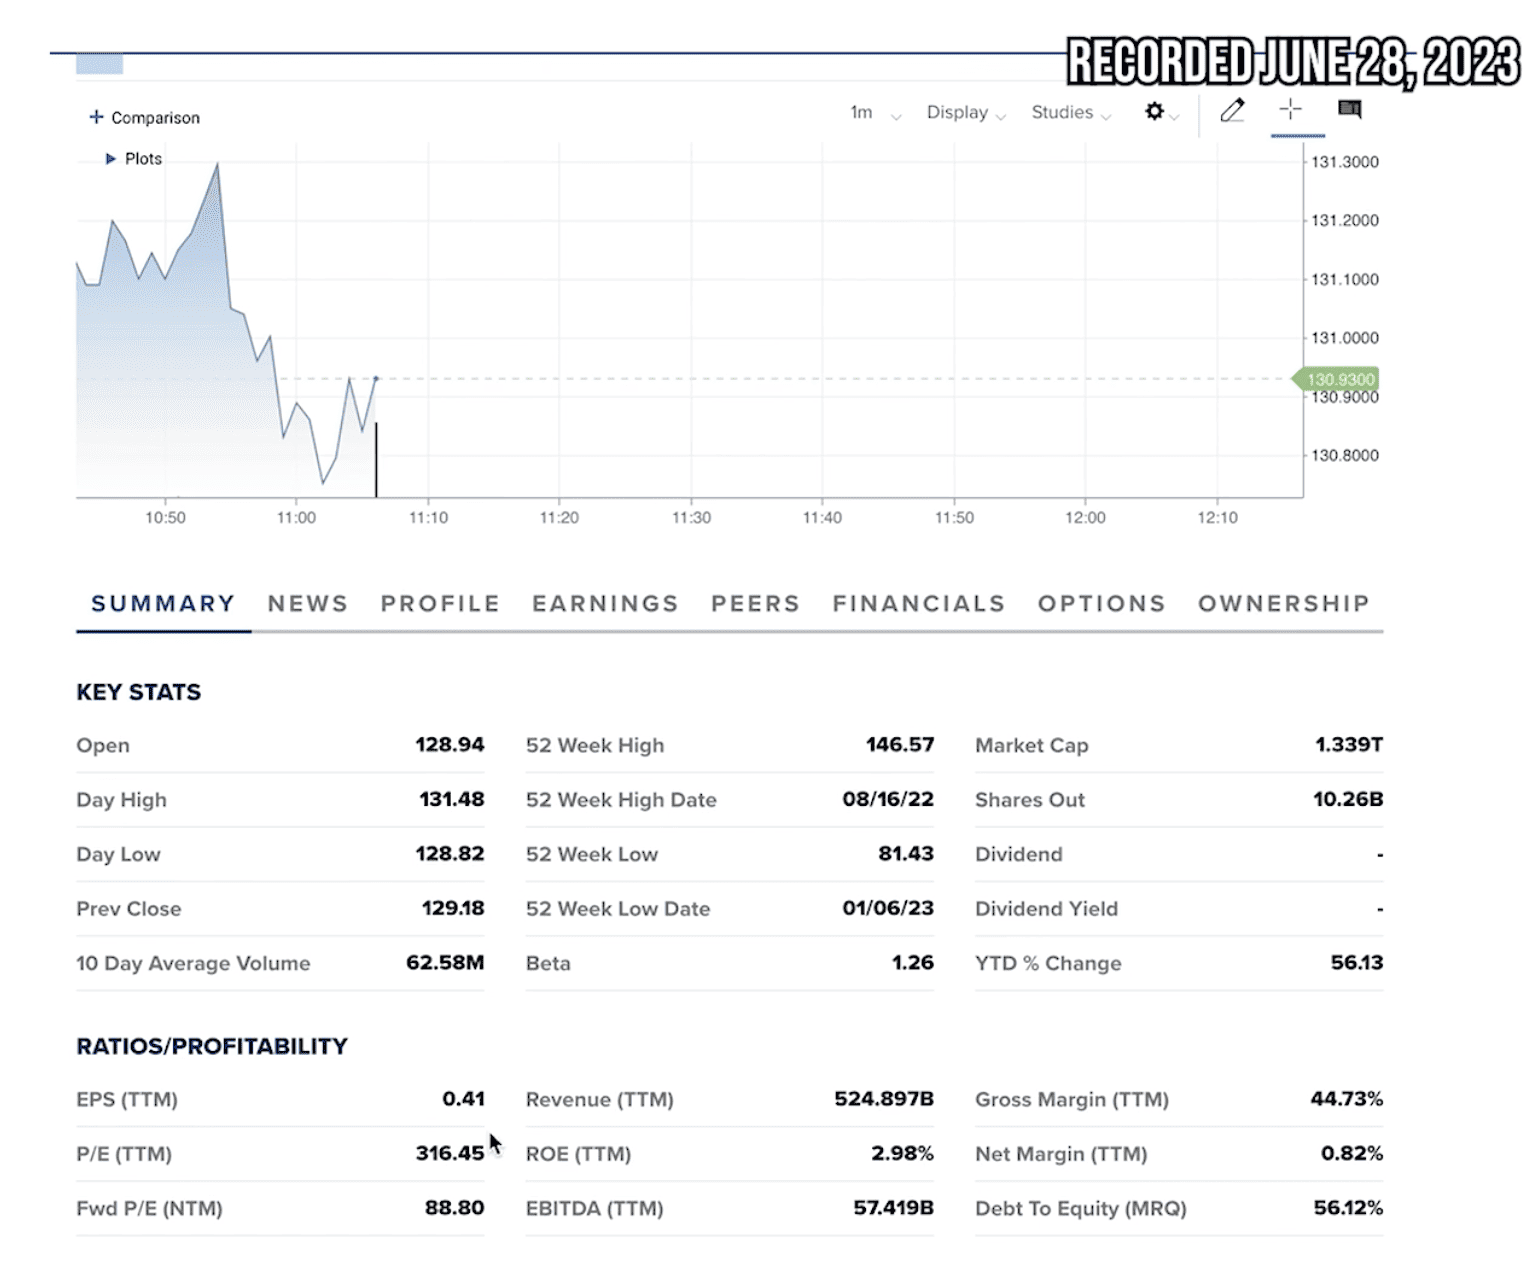
FIGURE 5 – Amazon Price-to-Earnings Ratio – CNBC
Nvidia is trading at about 212 times next year’s earnings. These ratios are out of control. That tells us that these stocks are very expensive.
Cautious Optimism for the Second Half of 2023
If we think about how much of the market is being driven by just a handful of stocks and the price-to-earnings ratios on those stocks and how overvalued they are, we need to have cautious optimism. The optimism is that the Fed is hopefully done with its aggressive rate hiking cycles and that we can get back to some sort of normal inflationary number. But we need to be cautious with valuations on some of the big tech companies. This is not a time where you should be getting fear of missing out (FOMO).
A Flashback to 1999
I saw this happen in 1999 where all the tech stocks were running up the big brick and mortars and stable companies. Consumer staples were all just kind of boring. They were doing what they normally should do. But so much money flew into the Nasdaq. In fact, most of the money that went into technology stocks during the Dot-Com Bubble came in the last quarter of 1999.
Don’t let these highfliers confuse you that everything in the market is going great right now. That’s simply not the case. You really need to look at what is driving the stock market. There are a lot of stocks in the S&P 500 that are negative this year. There are a lot of stocks in the Nasdaq-100 that are negative this year. And there are a lot of areas in the economy that are seeing some cracks.
The Latest Look at the Steeply Inverted Yield Curve
And we still have this very steeply inverted yield curve. I think it’s worth mentioning again. I’ve been giving updates on the yield curve for several months now to show how inverted it is. The highest yielding treasury today is the four-month treasury at 5.49%, the six-month and three-month are at 5.47% and 5.44%, respectively. But then the 10-year treasury is only at 3.71%.
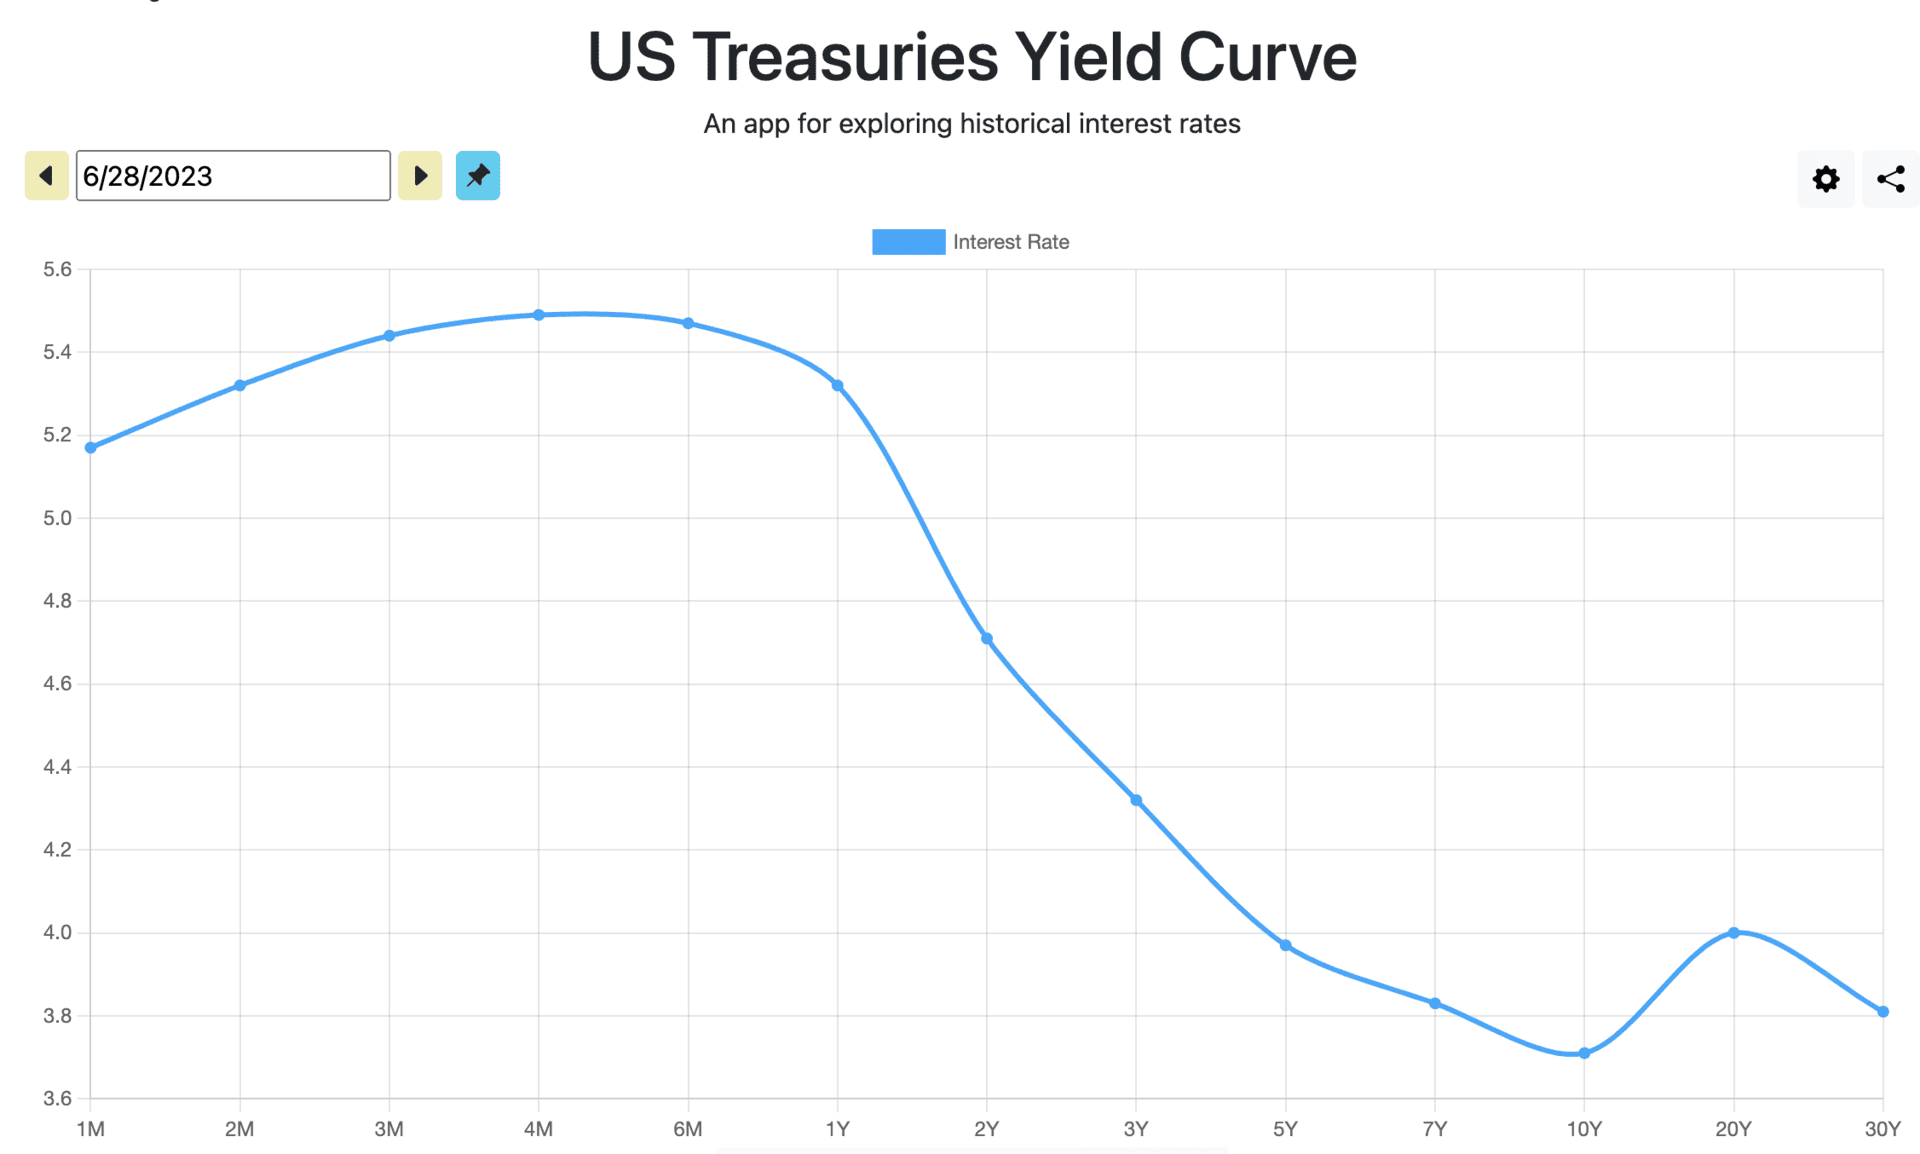
FIGURE 6 – U.S. Treasuries Yield Curve
This steeply inverted yield curve still says that the bond market believes that the longer-term economic outlook is for a slowing economy. Does that mean we go into a recession? I don’t know.
A Silent Recession?
Stansberry Research just published a report that said that there are many parts of the economy that they consider to already be in a recession, even though the official definition of a recession is two consecutive quarters of negative GDP. A lot of what’s happening is tied to a very narrow sector of the economy.
Looking at a Midyear Rebalance
As we end the first half of the year, it’s important to look at your portfolio. If you are tech heavy, maybe it’s time to do some rebalancing. Take some money off the table. Go back into some more value-oriented areas or maybe even into some safer areas.
Again, the phrase of the day is cautious optimism. I hope that the Fed is done with the rate hiking cycle. However, it looks like there’s probably a couple of more to come. I think inflation is going to persist for the next six to nine months, so I wouldn’t really expect any reversal in the Fed’s stance until 2024.
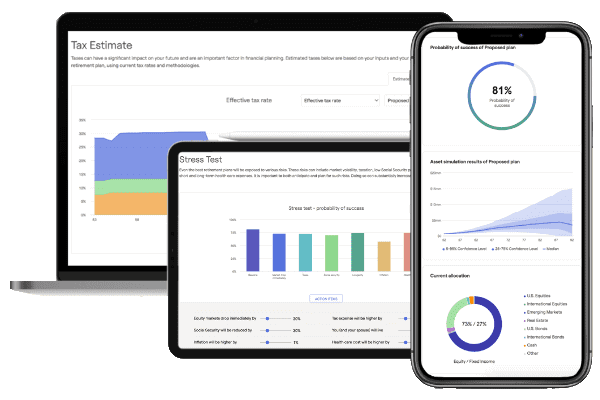
Your Investment Portfolio Is Just One Part of Your Overall Financial Plan
Along with looking at midyear rebalance, we must remember that investments are simply the engine that make the financial plan run. You need a comprehensive financial plan that looks at things such as Social Security, taxes, estate planning, and risk management. We want you to see how that can all come together for you, so we’re giving you the chance to use our industry-leading financial planning tool. It’s the same tool that our CFP® Professionals use with our clients, and you can use it from the comfort of your own home by clicking the “Start Planning” button below.
As you’re using our planning tool, keep in mind that it’s intended for professional use. We’re here to answer your questions—whether it’s about what’s driving the stock market or more importantly, what needs to be incorporated into your financial plan. And this is YOUR financial plan. That means that you need to be building a plan that’s designed to accomplish your goals as you’re going to and through retirement.
So, if you have questions about the retirement planning process, let us know. By clicking here, you can schedule a 20-minute “ask anything” session or complimentary consultation with one of our CFP® Professionals. We can meet with you in person, virtually, or by phone.
Stay Tuned for My July Monthly Economic Update
With that, I hope you all have had a great first half of the year. I’m looking forward to the second half of the year and will report back with you at the end of July for my July Monthly Economic Update.
Investment advisory services offered through Modern Wealth Management, LLC, an SEC Registered Investment Adviser.
The views expressed represent the opinion of Modern Wealth Management, LLC, an SEC Registered Investment Adviser. Information provided is for illustrative purposes only and does not constitute investment, tax, or legal advice. Modern Wealth Management, LLC does not accept any liability for the use of the information discussed. Consult with a qualified financial, legal, or tax professional prior to taking any action.