Q3 2025 Market Update
Key Points – Q3 2025 Market Update
- Another Strong Quarter from the U.S. Stock Market
- Technology Sector Drives the S&P 500’s Performance
- FOMC Cuts Its Federal Funds Target Rate for First Time in 2025
- 6-Minute Read | 10-Minute Watch
Recorded on October 17, 2025
Schedule a Meeting Get the Retirement Plan Checklist
Q3 2025 Market Update
Welcome to the Modern Wealth Management Educational Series. Today, I’ll be covering all the market action from the third quarter.
Q3 2025 Market Update: Another Strong Quarter from the U.S. Stock Market
The U.S. stock market delivered another strong quarter in Q3, up over 8%.1 That was following an almost 11% gain in the second quarter.
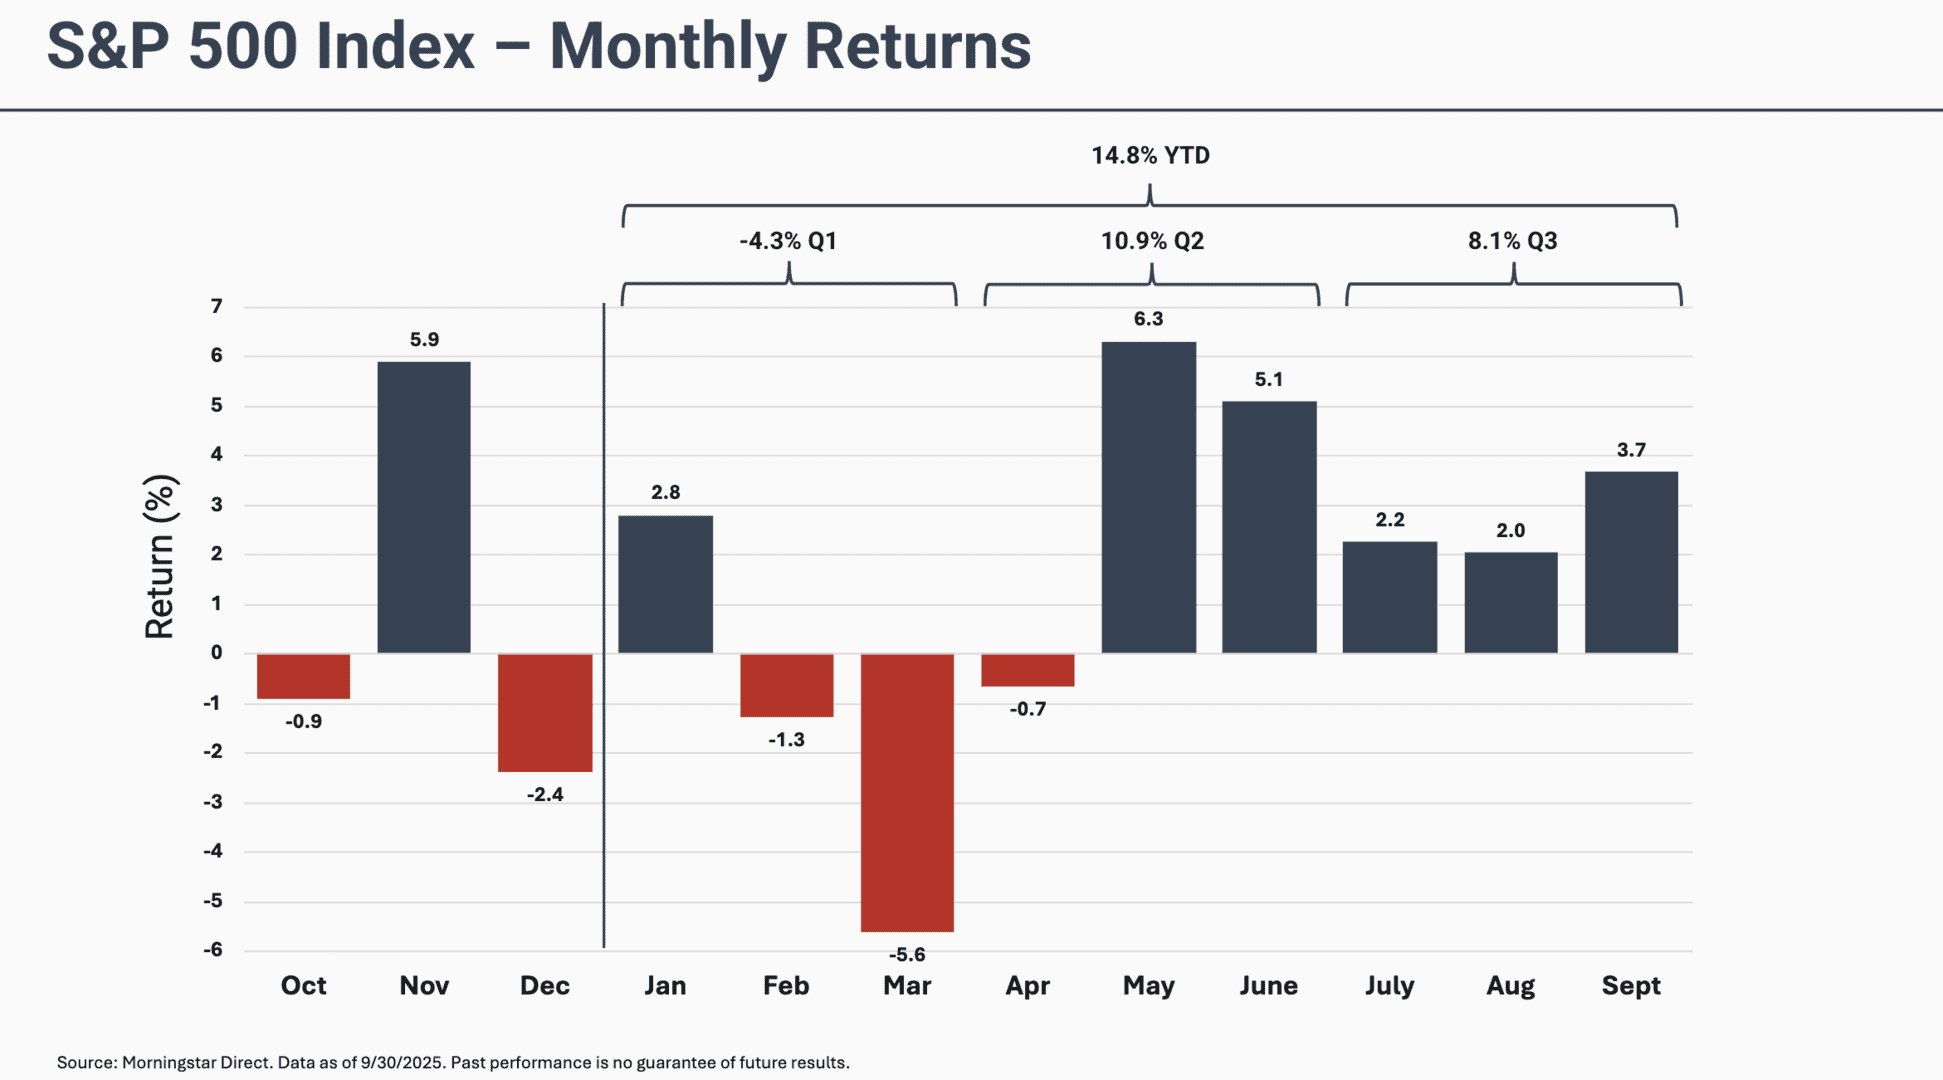
FIGURE 1 – S&P 500 Index Monthly Returns – Morningstar Direct
The first quarter was a little choppier. We had the big draw down in March, but all in all combined together, we’re up almost 15% on a year-to-date basis.
Within Q3, you can see July and August about the 2% range and then a really strong showing in September, up almost 4%.2 So, it’s been a very good year so far for the U.S. stock market. Let’s hope this can hold throughout 2025. Let’s take a look now at the journey.

FIGURE 2 – S&P 500 Index Year-to-Date – FactSet
This is the S&P 500 price index over time. At the start of the year, you can see we got off to really a nice start, just kind of grinding higher. Then, in April, we had the tariff announcement that caused quite a bit of turbulence and volatility in the equity market, and we drew down a fair bit.
But really from that point, it’s been from the lower left to the upper right. We’ve just been grinding higher and higher in this bull market and are now touching all-time highs and have done so quite a few times along the way.3 The S&P 500 is up almost 15% year to date and been relatively smooth journey since the April announcement.
Q3 2025 Market Update: U.S. Equity Returns by Sector
Let’s dive a little bit deeper now and look at the sector performance within the S&P 500. Just to put some context around it, we’ve broken the S&P 500 down into the various sector weights.

FIGURE 3 – U.S. Equity Returns Sectors – Morningstar Direct
That technology sector is far and away the largest sector within the index. We got 8.1% from the S&P 500, but where did that come from? What sectors contributed to that? Again, it was driven by technology.
Any strong returns there given the large weight do tend to contribute quite a bit to the index’s performance. It’s interesting to see that and it’s also a warning sign that if we do have a big sell-off in technology, that will likely drive the whole index a lot lower just given the proportional weight there.
In the lower section of the table on the right in Figure 3, you can see the performance of each sector as well. The only negative performing sector for Q3 was consumer defensives.
Q3 2025 Market Update: U.S. Equity Returns by Size and Style
Looking at the index just a little bit differently, let’s break things down by the size of companies — large and small — and then by value and growth, their descriptors.

FIGURE 4 – U.S. Equity Returns Size and Style – Morningstar Direct
For the third quarter, small caps did a lot of the catch-up work. It was good to see a widening of breadth across the market index. On the large side, it was a growth story versus value with growth outperforming again. That tends to be the case when technology leads things because technology and large-cap growth go hand in hand.
It’s been a similar story year to date. Large-cap growth has been the driver, but there’s some contribution to from the value side. We are starting to see a bit of a widening out in the performance of the U.S. stock market, which is encouraging. We don’t want to be a narrow market that’s driven higher just by a few companies, so the breadth is important.
Q3 2025 Market Update: Global Equity Returns by Country
Looking outside of the United States, it’s been a particularly strong year for other stock markets.4 Q3 performances are highlighted in blue for these different markets, which year-to-date performance is in gold.

FIGURE 5 – Global Equity Returns by Country – Morningstar Direct
Canada is up almost 27% year-to-date and the UK and France aren’t far behind. Germany has also been really strong year-to-date at 33%, but was down for Q3 following a really stellar start in Q1 and Q2.
Brazil has been doing really well, up almost 40% in dollar terms. Emerging markets are also hanging in there.
China has been up quite a bit, but India has been negative both on a quarterly basis and year-to-date basis. So, there are some issues there (in India), but it’s been a generally strong period for non-U.S. stocks, which serves a real reminder of why it’s important to be globally diversified.
Here in the United States, U.S. investors tend to have a home bias. We like things that are familiar and that has worked in our favor, frankly, for quite a few years. But this year has been a real turn around, where we’ve seen relative outperformance by the stock markets outside of the United States.
Q3 2025 Market Update: The U.S. Bond Market
Let’s switch gears here and focus on the U.S. bond market. Similarly, it was a really nice quarter for Q3. All the different bond indices were up nicely.

FIGURE 6 – U.S. Bond Market Performance – Morningstar Direct
The U.S. aggregate bond market was up 2%, which is a really strong quarter for a fixed income index.5 Treasury bonds, mortgage bonds, corporate bonds, high yield bonds are all doing similarly well.
Year-to-date, the bond market is up 6.1%. That’s been a refreshing change from the prior few years when fixed income came under pressure with rates moving higher. As rates go up, the value of bonds goes down and vice versa. It’s been a tough environment for the bond index over the last several years, but we’ve started to see that turn around. So, the bond side of investors’ portfolios has been quite good as well this year.
Q3 2025 Market Update: FOMC Cuts Its Federal Funds Target Rate for First Time in 2025
There was some big news back in September, as the FOMC met to make another rate decision. They finally made a cut at September’s meeting after previously staying steady and holding out all year.

FIGURE 7 – U.S. Bond Market Federal Funds Target Rate – FactSet
There are two more FOMC meetings in 2025 and obviously a lot more in 2026. The big question now is whether this will be the beginning of a rate-cutting cycle or more of a cut and hold from the Fed.
We’re seeing some indication that they will embark on further cuts, listening to commentary from various Fed officials. There seems to be signals that we should expect several cuts in the near future. That generally bodes well for fixed income. When the base rate is headed lower, it tends to help the rest of the curve, but not always.
The longer-dated bonds are independent from the Federal Funds rate, which is the base rate that the Fed is controlling. It doesn’t always work that the Fed lowers and then let’s say the 10-year treasury lowers. There can be some divergence there and they operate in different ways. But in general, it’s good for the base rate to be headed lower for rates across the curve, as it creates a nice environment for that to ease lower.
Assessing the FOMC’s Dot Plot
Speaking of rates and expectations, let’s look at the dot plot — the projected Federal Funds rate.6 This comes from the Fed’s statement, the summary of economic projections. These are the different Fed officials and how they’re indicating or forecasting rates into the future.
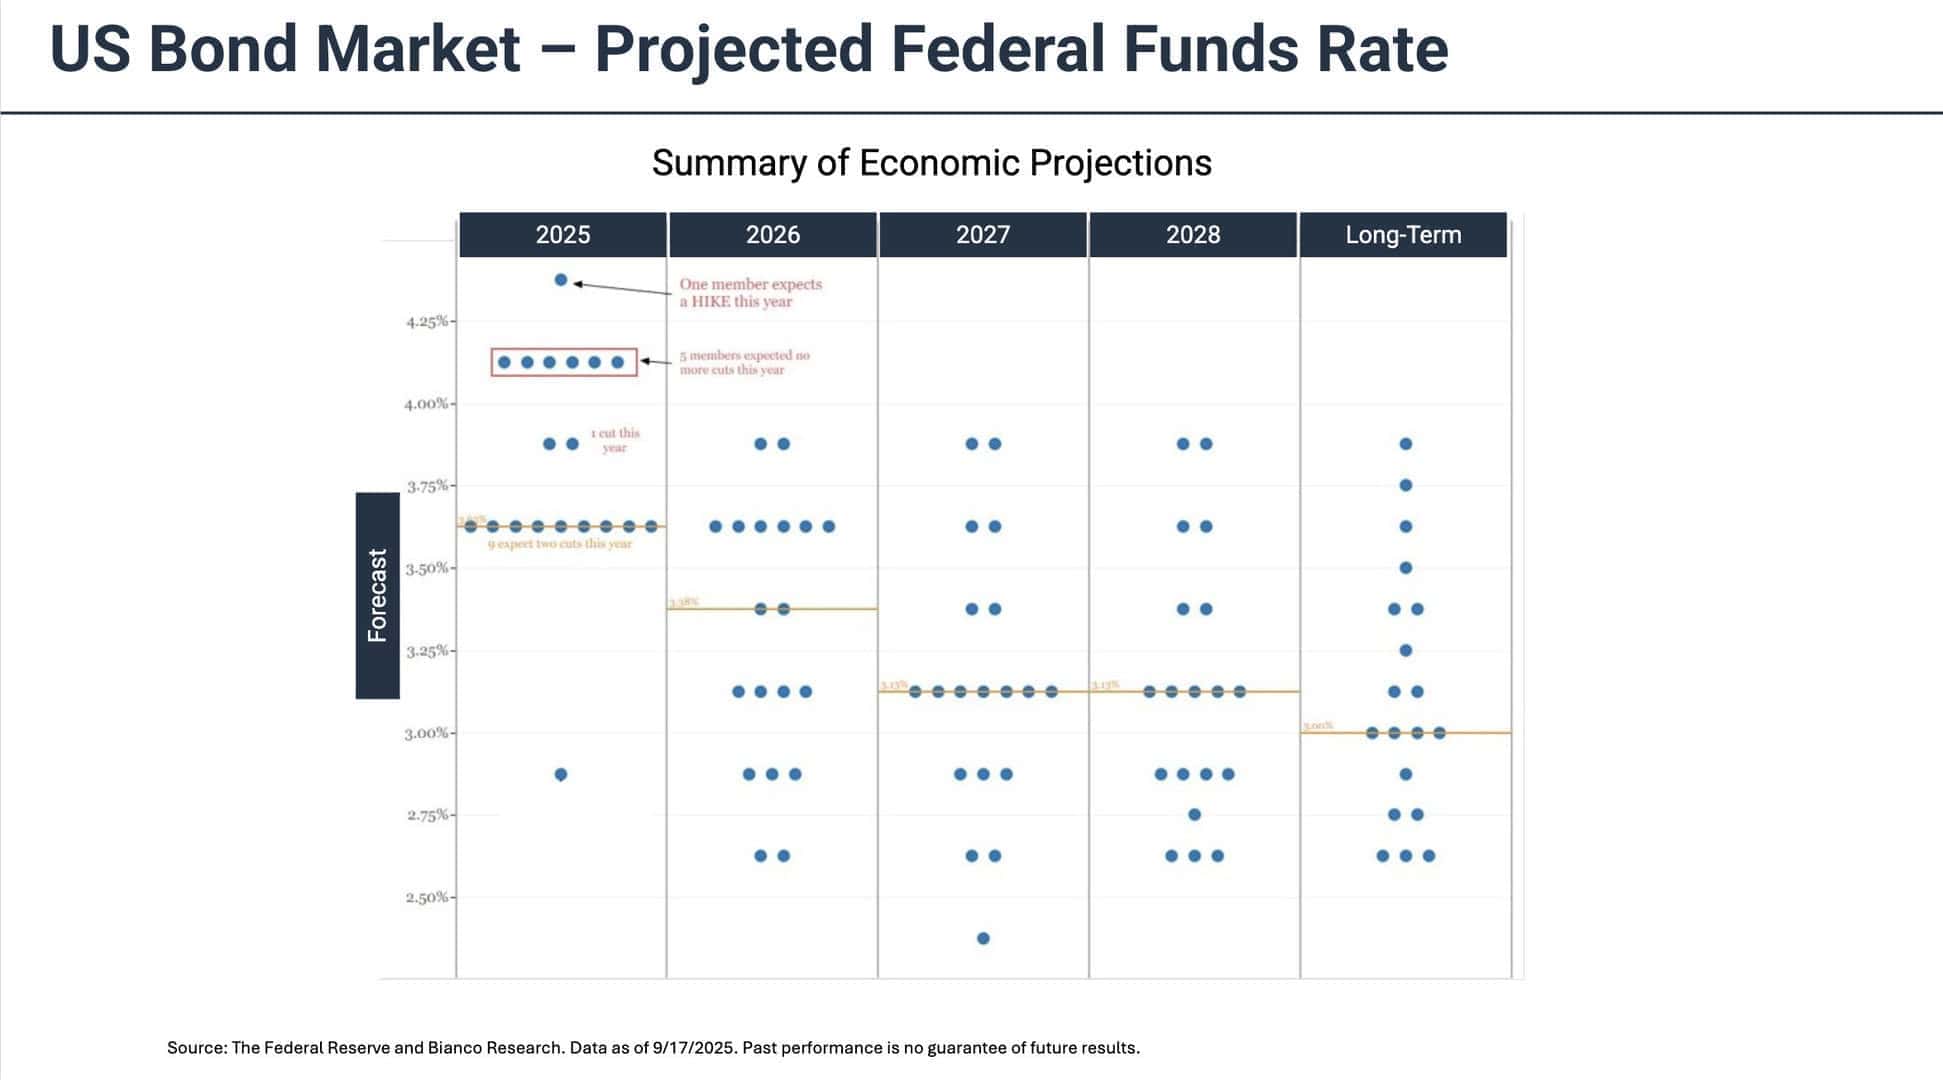
FIGURE 8 – U.S. Bond Market Projected Federal Funds Target Rate – The Federal Reserve and Blanco Research
One individual had one hike for the rest of the year. I’m not quite sure which Fed official that is, but there certainly is not consensus there. Five members are expecting no more cuts this year, but nine or so — so consensus — are in the two-cut realm. I think was a positive for the markets to see that.
Looking at a little further into the future, these aren’t often great predictors of what actually happens, but it’s interesting to get a lens into the Fed members’ minds and how they see things. It is a progressive move lower throughout 2026, 2027, and 2028.
Longer term, it looks like the average is around 3%, so we’ll see how that plays out. The main factor working against rate cuts is inflation. That’s the dual mandate that the Fed has to operate within. Price stability and maximum employment can be in conflict. It’s always interesting to see which of those the Fed is focused on the most at any given time.
Alright, so those are the FOMC members’ expectations of future rate cuts. Now, let’s turn to what the market expects. In Figure 9, below, we’re looking at the SOFR’s Futures, so the short-term base rate, the futures market, and what the expectations are.

FIGURE 9 – U.S. Bond Market Projected Federal Funds Target Rate – Bloomberg Data
You can clearly see in orange that there is an expectation of several additional cuts. If the Fed disappoints the market by not delivering those cuts, it could cause some turbulence in the future. It’s looking relatively baked in from a market perspective, but the Fed does need to then meet that expectation or we could see some level of turbulence.
Stay Tuned for a Recap of Q4 and 2026 Year-in-Review
All in all, it was a great quarter for risk assets, both on the equity side and the fixed income side, making those balanced portfolios have a particularly good time. We don’t know what Q4 will bring, but we will be monitoring it very closely and keeping you all apprised. Thanks for joining us for this Q3 2025 market update. We look forward to seeing you in the future.
If you have any questions about what we’ve covered during this Q3 2025 market update and how it relates specifically to your situation, start a conversation with our team below. We welcome the opportunity to connect with you and assist you with preparing a plan that helps you enjoy life today, all while building confidence for tomorrow.
Resources Mentioned in This Article
- Assessing Market Volatility Following April 2 Tariffs
- Navigating Economic Uncertainty: Special Market Update
- Federal Reserve Cuts Interest Rates for First Time in 2025, Eyes Two More This Year
Other Sources
[1] https://finance.yahoo.com/quote/SVSPX/performance/
[2] https://ycharts.com/indicators/sp_500_monthly_return
[3] https://finance.yahoo.com/news/markets-keep-time-highs-lots-220300897.html
[4] https://www.msci.com/indexes#featured-indexes
[5] https://www.etftrends.com/etf-strategist-channel/q3-2025-signal-through-static/
[6] https://www.federalreserve.gov/monetarypolicy/files/fomcprojtabl20250917.pdf
Investment advisory services offered through Modern Wealth Management, Inc., a Registered Investment Adviser.
The views expressed represent the opinion of Modern Wealth Management a Registered Investment Advisor. Information provided is for illustrative purposes only and does not constitute investment, tax, or legal advice. Modern Wealth Management does not accept any liability for the use of the information discussed. Consult with a qualified financial, legal, or tax professional prior to taking any action.